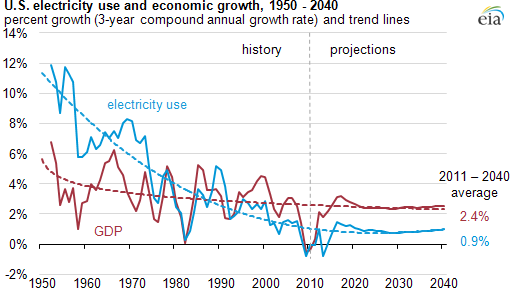
The efficiency of energy use in growing the U.S. economy has made dramatic improvements over the past 60 years. Before the mid-1980s electrical energy usage grew faster than GDP growth but since then the relationship has reversed. Projections by the U.S. EIA (U.S.
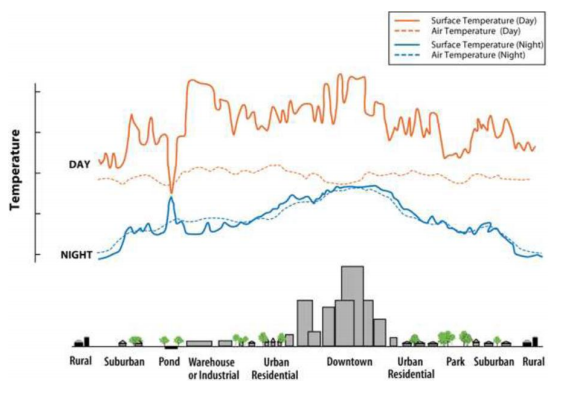
This hypothetical graph shows how daytime and nighttime temperature vary in the vicinity of a large city. Notice how daytime temperature is higher over heat-reflecting buildings and lower over a water body. The urban heat island effect causes cities to run warmer than surrounding rural areas, especially at night. Development produces heat islands by replacing vegetation, particularly forests, with pavement and other urban infrastructure.
The Maritime Alliance is the cluster organizer for the San diego maritime technology community and fosters maritime business and technology innovation through collaboration around the U.S. and the world.
Drought conditions have been at record levels in the contiguous United States for much of July, according to the National Drought Mitigation Center, which began monitoring drought conditions in 1999. The animated map below shows the spread of drought conditions since January 2012.
Every year, the United States consumes more than 3 trillion KWh of electricity. This power is generated by coal-fired power plants, nuclear plants, solar panels, hydroelectric damns, wind turbines, geothermal wells, and other sources and it requires water to produce.
You need lots of water and a lot of land where you can build a dam and reservoir, which all takes a LOT of money, time, and construction. The trend for the future will probably be to build small-scale hydro plants that can generate electricity for a single community.