Facebook Posts

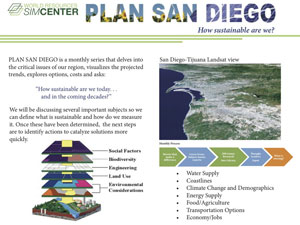
Plan San Diego PDF
Submitted by glenshewchuck on
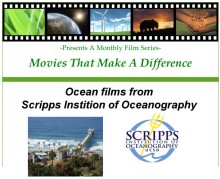
Movie Night
Submitted by glenshewchuck on
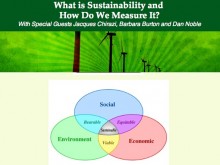
Green Scene
Submitted by glenshewchuck on
Visualizing sustainable solutions
to global and local problems
so society makes
informed choices quicker