Facebook Posts

pollution water

Source: 

http://www.acralive.org/2011/11/water-pollution-drought-threaten-worlds.html

Image: 

pollution water


Prosperous countries have not lived up to their promises to help the poor, the UN declared, saying poor people often go hungry because of polluted water, drought and other environmental factors that are increasing poverty.

Image Type: 

Category: 

Level: 

Geographic Area: 

water pollution

Source: 

http://tommytoy.typepad.com/tommy-toy-pbt-consultin/2011/03/infographic-the-worlds-drinking-water-crisis-pollution-and-water-scarcity-reaching-epidemic-proporti.html

Image: 

water pollution


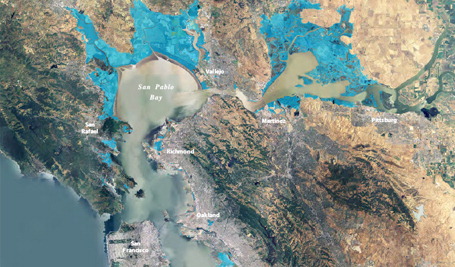
As you can readily see from the following World Water Pollution Map, pollution continues to be a problem, especially in industrialized nations, where a lot of pollutants are finding their way into our river's and oceans.

Level: 

Image Type: 

Category: 

Trends in global water use by sector

Source: 

http://www.grida.no/publications/vg/water2/page/3229.aspx

Image: 

Trends in global water use by sector

the increased use of water is truly impressive, and the difference between consumption and Withdrawal will increase over time. The agricultural sector is the sector that consumes the most water today and probably in the future.

Level: 

Image Type: 

Category: 

For 884 million people, drinking water looks like this.

Source: 

printerest.com/pin/283586107755872101/

Image: 

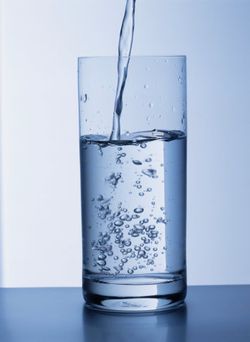
For 884 million people, drinking water looks like this.

A child dies every 15 seconds from poor sanitation and water supply.

1 Billion People lack access to clean water and 2.3 Billion people are without basic sanitation.

Preventable water related diseases kill more than 5 Million People every year.

Level: 

Image Type: 

Category: 

withdrawal and consumption water in the world

Source: 

http://www.grida.no/publications/vg/water2/page/3228.aspx

Image: 

withdrawal and consumption water in the world


Freshwater use by continents is partly based on several socio-economic development factors, including population, physiographic, and climatic characteristics. Analysis indicates that:

- Annual global freshwater withdrawal has grown from 3,790 km3 (of which consumption accounted for 2,070 km3 or 61%) in 1995, to 4,430 km3 (of which consumption accounted for 2,304 km3 or 52%) in 2000 (Shiklomanov, 1999).

Level: 

Image Type: 

Category: 

Countries on droughts, 2009

Source: 

http://www.google.com/imgres?um=1&hl=en&client=firefox-a&rls=org.mozilla:en-US:official&biw=1920&bih=973&tbm=isch&tbnid=8-OzLCi636S20M:&imgrefurl=http://www.greatdreams.com/climate/drought-2009.htm&docid=4YpFL6NvrruocM&imgurl=http://www.greatdreams.com/climate/Countries_by_agricultural_drought.png&w=923&h=480&ei=6SX7T4D3Lo61qAHpvpCPCQ&zoom=1&iact=hc&vpx=163&vpy=170&dur=3432&hovh=162&hovw=312&tx=208&ty=127&sig=117909653472347018289&page=1&tbnh=102&tbnw=197&start=0&ndsp=43&ved=1t:429,r:0,s:0,i:72

Image: 

Countries on droughts, 2009

These were the current situation in 2009. Most part of Asia, North and South America and Africa are suffering from agricultural droughts.

Level: 

Image Type: 

Category: 

Distribution significant samples of corprate regions from the world

Source: 

http://www.assemblee-nationale.fr/13/rap-info/i4070.asp

Image: 

Distribution significant samples of corprate regions from the world

States that collect the most water are those where irrigated agriculture is very important. There are currently 280 million hectares irrigated worldwide, against 190 in 1980. Irrigated agriculture is responsible for 95% of freshwater withdrawals in some developing countries. Looking at the share of renewable resources withdrawn for agriculture, there are clear differences. In some areas, the resource is not mobilized, including where agricultural use is overwhelmingly dominant, either due to low population density or poor management of the resource.

Level: 

Image Type: 

Category: 

Pages