2050 Regional Growth ForecastSubmitted by c.bernhardt.14 on Thu, 08/28/2014 - 4:55pm Source: http://www.sandag.org/uploads/projectid/projectid_355_10792.jpgImage: SANDAG's regional growth forecast for San Diego through 2050.Image Type: GraphGeographic Area: San DiegoCategory: Resilient CitiesDevelopment IssuesHouseholdsJobsPopulationPopulation GrowthYear: 2010Level: Local
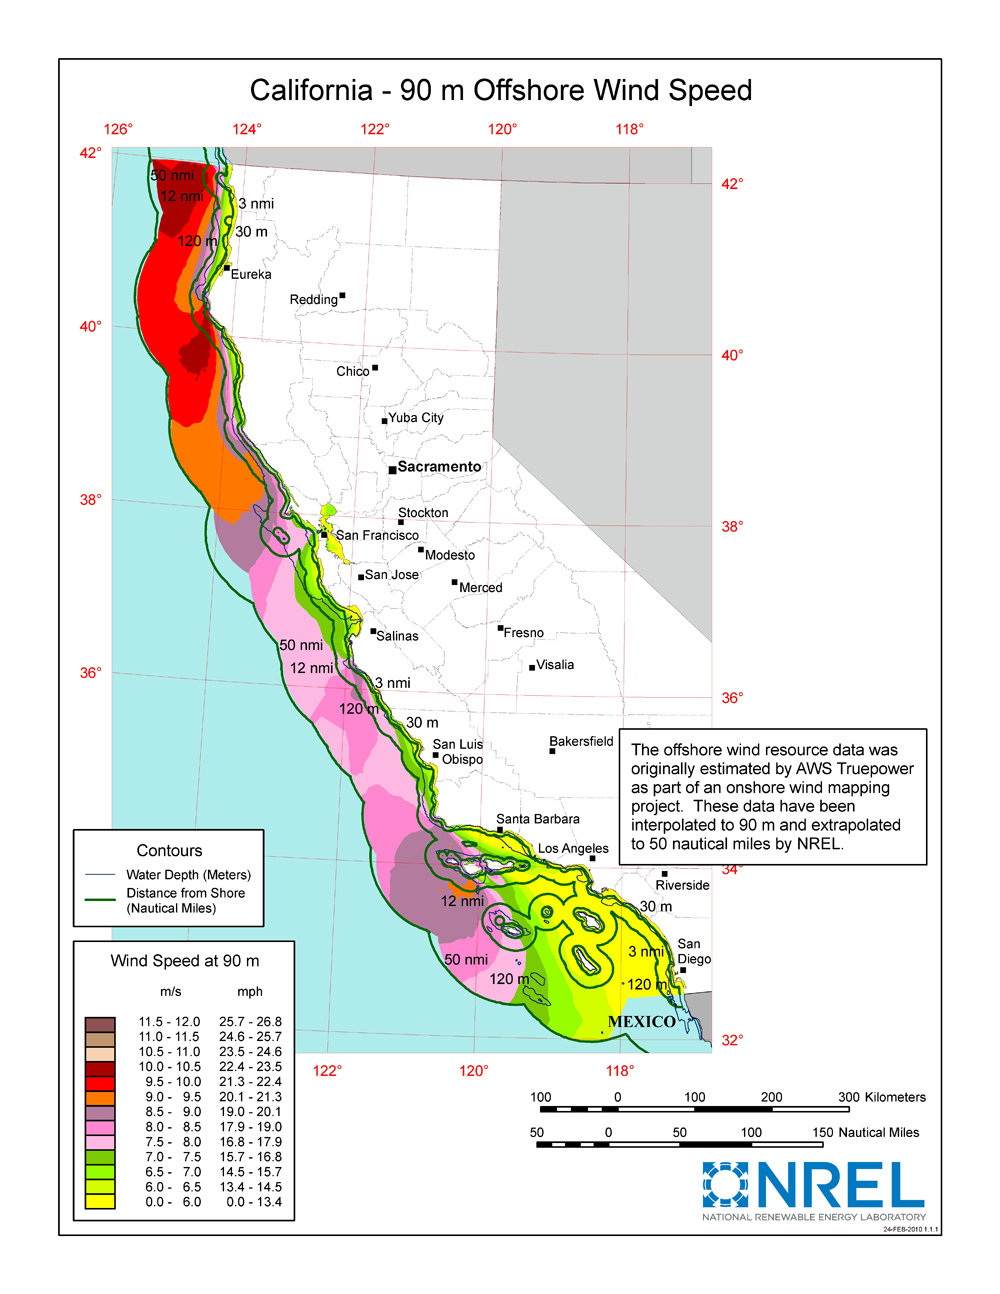
Offshore Wind CaliforniaSubmitted by alyssablack on Tue, 07/15/2014 - 4:08pm Source: http://apps2.eere.energy.gov/wind/windexchange/windmaps/offshore_states.asp?stateab=caImage: A map showing the offshore wind potential for California. Note that San Diego's potential is not very high.Image Type: MapGeographic Area: CaliforniaCategory: 100renewablesandiegoYear: 2010Level: State
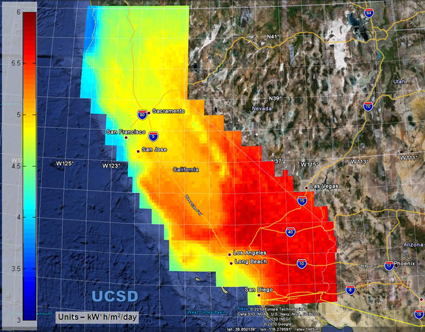
Solar Map of CaliforniaSubmitted by alyssablack on Tue, 07/15/2014 - 3:42pm Source: http://www.sensysmag.com/spatialsustain/researchers-publish-improved-solar-map-for-california.htmlImage: A map showing the solar potential for California. Note that San Diego's potential is high.Image Type: MapGeographic Area: CaliforniaCategory: 100renewablesandiegoYear: 2010Level: State
Defense Spending compared to the Federal BudgetSubmitted by marcusaluna on Wed, 01/18/2012 - 2:20pm Source: http://www.heritage.org/research/reports/2010/06/~/media/Images/Reports/2010/b2418_chart2.ashxImage: Defense Spending compared to the Federal BudgetImage Type: GraphGeographic Area: United StatesCategory: ExpendituresCostsFinance and InvestmentsYear: 2010Level: National
Defense Spending in the US over the past 70 yearsSubmitted by marcusaluna on Wed, 01/18/2012 - 2:10pm Source: http://www.heritage.org/research/reports/2010/06/~/media/Images/Reports/2010/b2418_chart1_1/b2418_chart1_2.ashxImage: Defense Spending in the US over the past 70 yearsImage Type: GraphGeographic Area: United StatesCategory: ForecastsExpendituresCostsFinance and InvestmentsYear: 2010Level: National
U.S CPI Inflation IndexSubmitted by marcusaluna on Wed, 01/18/2012 - 2:00pm Source: http://www.marketoracle.co.uk/Article25637.htmlImage: U.S CPI Inflation IndexImage Type: GraphGeographic Area: United StatesCategory: CPIFinance and InvestmentsYear: 2010Level: National
Bank prime loan rates from 1950 to 2010Submitted by marcusaluna on Mon, 12/19/2011 - 11:39am Source: http://2.bp.blogspot.com/_fZWzmzvDF4o/S930p7Af21I/AAAAAAAAAmY/Eomwi-bFsIA/s640/DPRIME_Max_630_378.pngImage: Bank prime loan rates from 1950 to 2010Image Type: GraphGeographic Area: United StatesCategory: CostsFinance and InvestmentsYear: 2010Level: National
OUR WATER OUR FUTURE 2009 UpdateSubmitted by tombartley on Wed, 12/07/2011 - 3:34pm Taxonomy upgrade extras: United States2010LocalWaterfield_vote: Select ratingGive OUR WATER OUR FUTURE 2009 Update 1/5Give OUR WATER OUR FUTURE 2009 Update 2/5Give OUR WATER OUR FUTURE 2009 Update 3/5Give OUR WATER OUR FUTURE 2009 Update 4/5Give OUR WATER OUR FUTURE 2009 Update 5/5Docment: our_water_our_future_final_clca_web_version.pdfSource: http://www.nettstrategies.com/uploads/Our_Water_Our_Future_Final_CLCA_Web_Version.pdfThe Status and Future of the San Diego Region’s Water Supply
Regional Results: Population, Jobs, HousingSubmitted by pmd on Tue, 10/18/2011 - 3:24pm Source: San Diego Association of Governments - SANDAG - http://www.sandag.org/uploads/projectid/projectid_355_10793.pdfImage: Projected Regional Results: Population, Jobs, Housing, 1970-2050From the San Diego 2050 Report from SANDAG.Image Type: GraphGeographic Area: San DiegoCategory: Population GrowthHouseholdsJobsYear: 2010Level: Local
Solar power growth by 2015 United StatesSubmitted by michaelkelly00 on Tue, 10/18/2011 - 1:33pm Source: cleantehnica.comImage: Projected growth of Solar Installations to reach 10 GW in 2015Image Type: GraphGeographic Area: United StatesCategory: Clean EnergyElectricity GenerationElectricitySolar EnergyEnergy ProductionYear: 2010Level: National