Facebook Posts

Electricity use and GDP

Source: 

http://blogs.edf.org/californiadream/page/13/?wvsessionid=35f357d2293b49059a82d2044643d9c2

Image: 

While California’s per capita electricity consumption has held steady for three decades, per capita gross state product (GSP) has doubled.  This shows that California’s economy has become less reliant on energy to produce goods and services

Image Type: 

Category: 

Level: 

Geographic Area: 

The Rosenfeld Effect

Source: 

http://www.mercurynews.com/breaking-news/ci_14059885

Image: 

Rosenfeld founded a group that became the lab's Center for Building Science. Research on the miniaturization of electronic ballasts in fluorescent lamps led to the development of the first compact fluorescent lamps. The center also developed low-emissivity windows as well as computer programs for the energy analysis and design of buildings.Though electricity demand nationwide has risen sharply in recent years, California's per capita electricity use has remained relatively flat since 1973 because of the state's strict energy-efficiency regulations.

Image Type: 

Category: 

Level: 

Geographic Area: 

CA Energy Sources

Source: 

http://energyalmanac.ca.gov/overview/energy_sources.html

Image: 

California is the eighth largest economy in the world, according to the state's Legislative Analyst's Office. To meet the needs of its growing population, California's economy depends upon affordable, reliable, and environmentally sound supplies of electricity, natural gas, and transportation fuels.

Image Type: 

Category: 

Level: 

Geographic Area: 

CA Water-related energy use

Source: 

http://grist.org/news/california-celebrities-are-wasting-electricity-moving-water-around/

Image: 

The staggering fact is the one highlighted: more than a fifth of all of the state’s electricity [used on water things!] goes to move water around. One-fifth!

Image Type: 

Category: 

Level: 

Geographic Area: 

CA electricity consumption by sector

Source: 

http://www.lbl.gov/Science-Articles/Archive/energy-myths2.html

Image: 

All major sectors of California's economy show modest, steady growth over the last decade. Between 1995 and 2000, the state's electricity consumption overall, as well as its residential sector, grew 2.5 percent per year. This growth rate is not unusual for the state when compared to the historic record, and is moderate when viewed in the context of the growing population and economy.

Image Type: 

Category: 

Level: 

Geographic Area: 

Extended nuclear generation outage increases Southern CA's energy prices relative to Northern CA

Source: 

http://www.eia.gov/todayinenergy/detail.cfm?id=10531

Image: 

Historically, wholesale power prices for Northern and Southern California tracked closely with one another, indicating minimal market differences between the two areas. However, after the shutdown of SONGS in early 2012, the relatively inexpensive nuclear generation produced by SONGS had to be replaced with power from more expensive sources. Consequently, since April 2012 Southern California power prices have persistently exceeded Northern California prices, with the spread averaging $4.15/MWh, or 12% of the Northern California price.

Image Type: 

Category: 

Level: 

Geographic Area: 

Electricity use and GDP projection

Source: 

http://econintersect.com/b2evolution/blog1.php/2013/03/25/electricity-usage-efficiency-5-fold-improvement-in-60-years

Image: 

The efficiency of energy use in growing the U.S. economy has made dramatic improvements over the past 60 years.  Before the mid-1980s electrical energy usage grew faster than GDP growth but since then the relationship has reversed.  Projections by the U.S. EIA (U.S.

Image Type: 

Category: 

Level: 

Geographic Area: 

The urban island effect

Source: 

http://www.accuweather.com/en/weather-blogs/climatechange/new-clues-about-the-urban-heat-1/42995

Image: 

This hypothetical graph shows how daytime and nighttime temperature vary in the vicinity of a large city. Notice how daytime temperature is higher over heat-reflecting buildings and lower over a water body. The urban heat island effect causes cities to run warmer than surrounding rural areas, especially at night. Development produces heat islands by replacing vegetation, particularly forests, with pavement and other urban infrastructure.

Image Type: 

Category: 

Level: 

Geographic Area: 

CA energy demand forecast

Source: 

http://www.energy.ca.gov/2012publications/CEC-200-2012-001/CEC-200-2012-001-SF-V1.pdf

Image: 

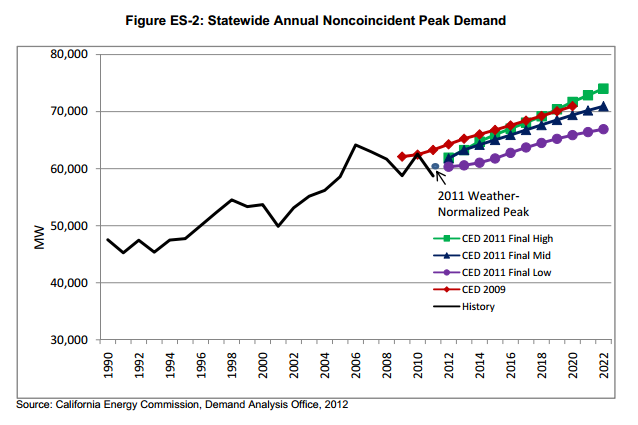
Unlike consumption, peak over all sectors in 2010 was very close to the CED 2009 statewide projection; although 2010 was a mild weather year overall, a heat storm event(extended heat wave) in September 2010 yielded a relatively high peak. The figure also indicates noncoincident weather‐normalized peak demand in 2011, higherthan the actualtotal since this was a relatively cool year. Growth rates in the forecast period are calculated relative to this weather‐normalized total, which is significantly lowerthan the peakpredicted in CED 2009.

Image Type: 

Category: 

Level: 

Geographic Area: 

VMT in CA

Source: 

http://next10.org/sites/next10.huang.radicaldesigns.org/files/2013%20California%20Green%20Innovation%20Index%20031913.pdf

Image: 

Total vehicle miles traveled (VMt) and VMt per capita declined slightly from 2007 to 2010 (-1% and -3.2%, respectively), though both increased compared to 2009 (Figure 34). Greenhouse gas emissions from transportation dropped by a much wider margin, with a ten percent drop in per capita emissions between 2007 and 2010, and a continued improvement since 2009 in both overall transportation emissions (-0.3%) and per capita transportation emissions (-1.1%).

Image Type: 

Category: 

Level: 

Geographic Area: 

Pages