Global

Migration Flows

Source: 

http://www.monde-diplomatique.fr/cartes/IMG/jpg/migrations-eco_big.jpg

Image: 

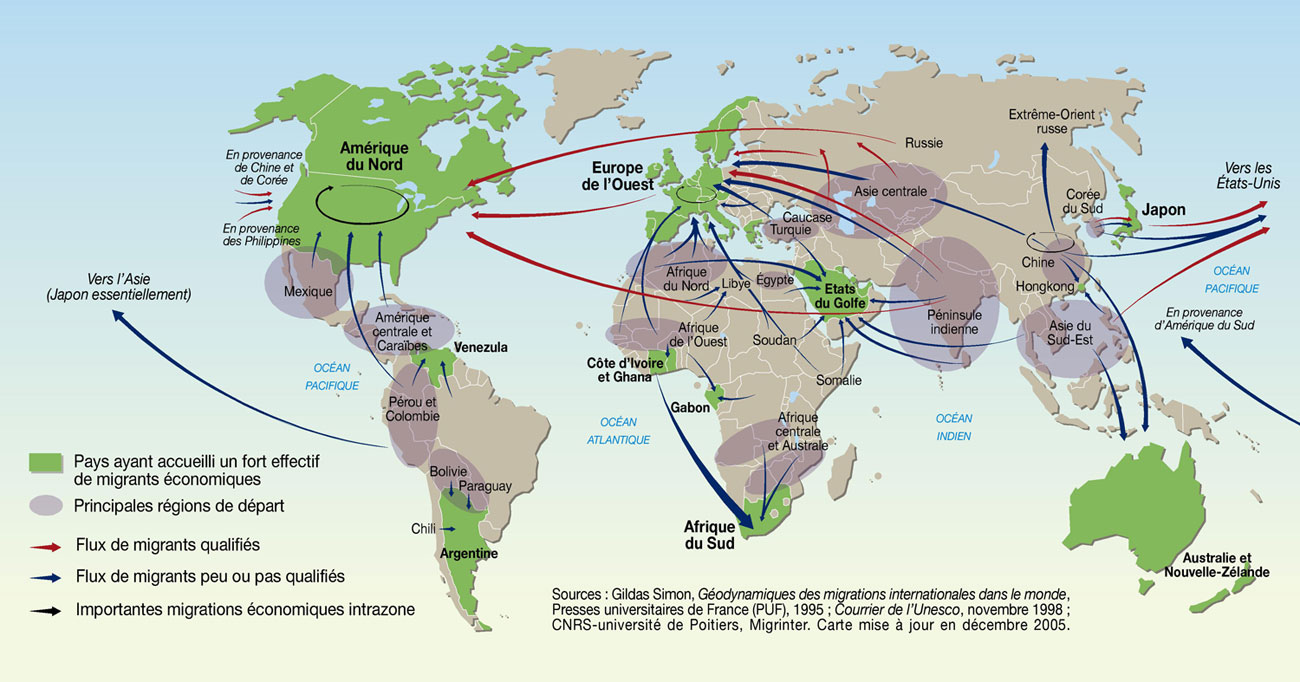
Migration Flows

There are different types of migration. The green countries are for economic purposes, but also for better living conditions. Gray regions are where most migrants are from due to their specific reasons. Red arrows à high skilled individuals going to countries for higher salaries/wages. There is also the idea of brain drain. Blue arrows represent the less qualified individuals going to countries for better living conditions. Many Hispanic people are migrating towards US. While North African populations are going to Europe whether it is legal or illegal but for a better life.

Level: 

Image Type: 

Category: 

unique online audience by age and gender, August 2011

Source: 

44- http://stakeholders.ofcom.org.uk/market-data-research/market-data/communications-market-reports/cmr11/international/icmr5.22

Image: 

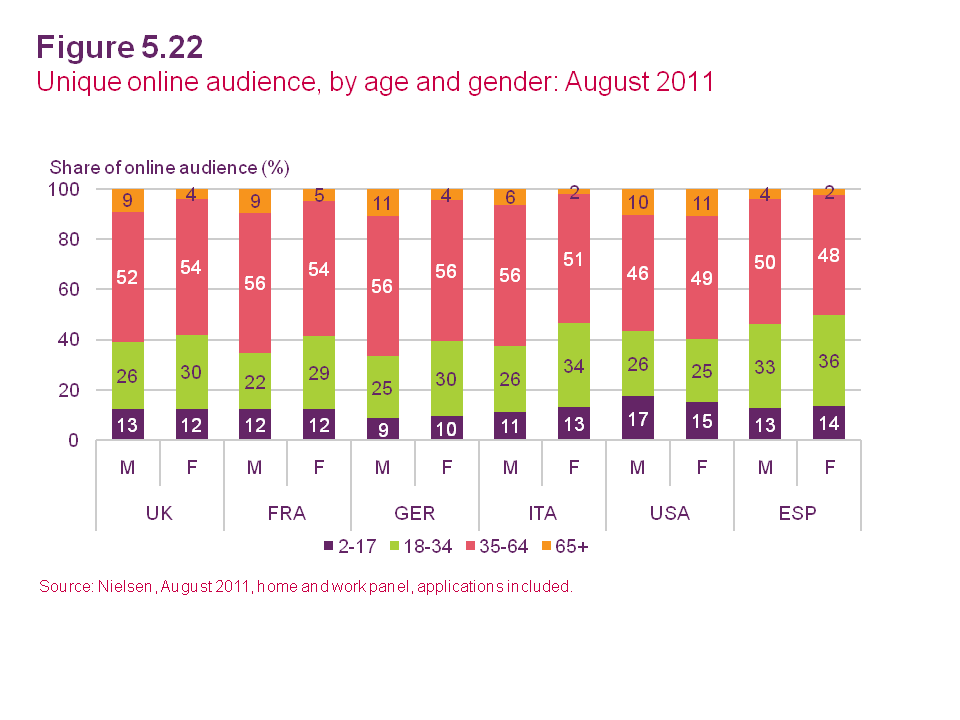
unique online audience by age and gender, August 2011

In most countries the gender differences are usually smaller than other gaps. In the case of the US, the difference in the rate of users among men and women is almost irrelevant, only around 2%


Level: 

Image Type: 

Category: 

Refugee and Asylum Seekers

Source: 

bodyontheline.wordpress.com/2009/06/20/on-refugees/

Image: 

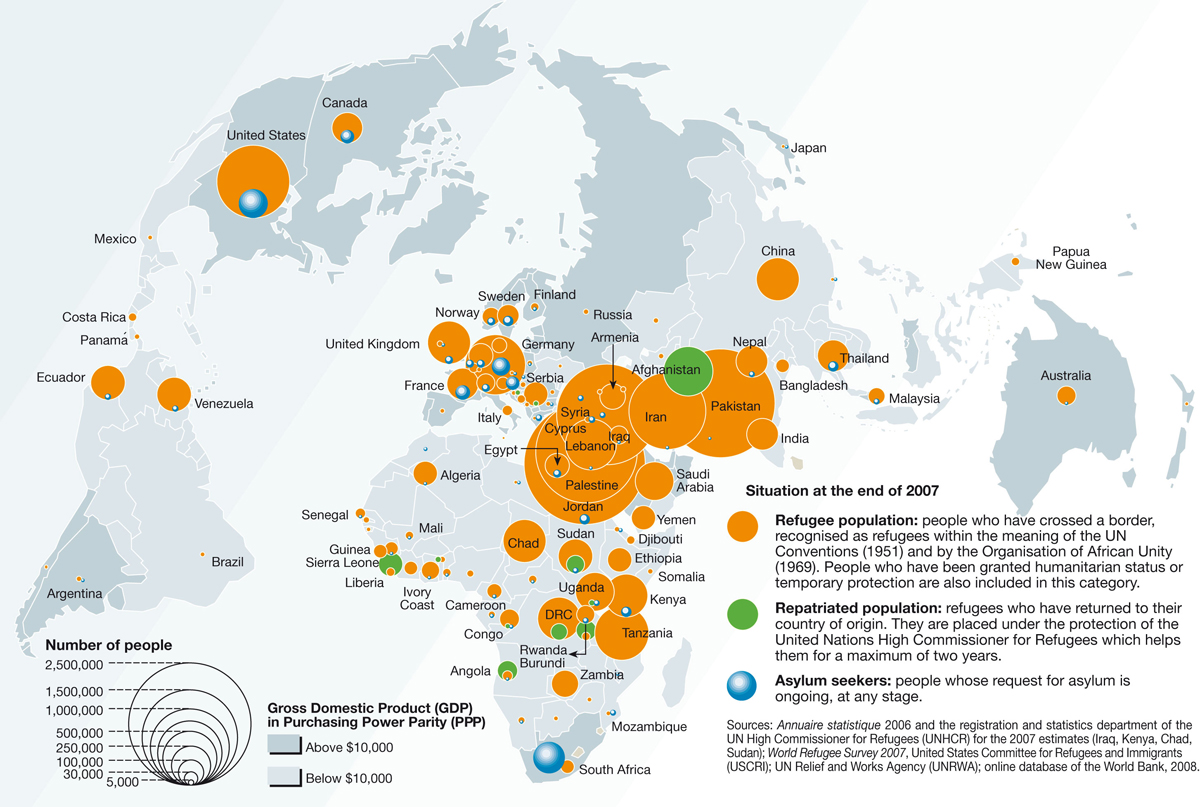
Refugee and Asylum Seekers

The main refugee problem lies around the middle east; especially b/c of the Israeli-Palestinian conflict, Palestinian refugee camps are dispersed all around in neighbouring countries. Refugees are also in the poorer countries, esp sub-Saharan African countries in Africa due to issues like government instability, problems with ethnicity, climate change, droughts, desertification, poverty, etc. where people have no choice but to take refuge in neighbouring countries.These refugees are under the temporary protection of UNHCR.

Level: 

Image Type: 

Category: 

Human Trafficking and Smuggling

Source: 

http://marysanyuosire.blogspot.com/2011/01/human-trafficking-vs-human-smuggling-as.html

Image: 

Human Trafficking and Smuggling

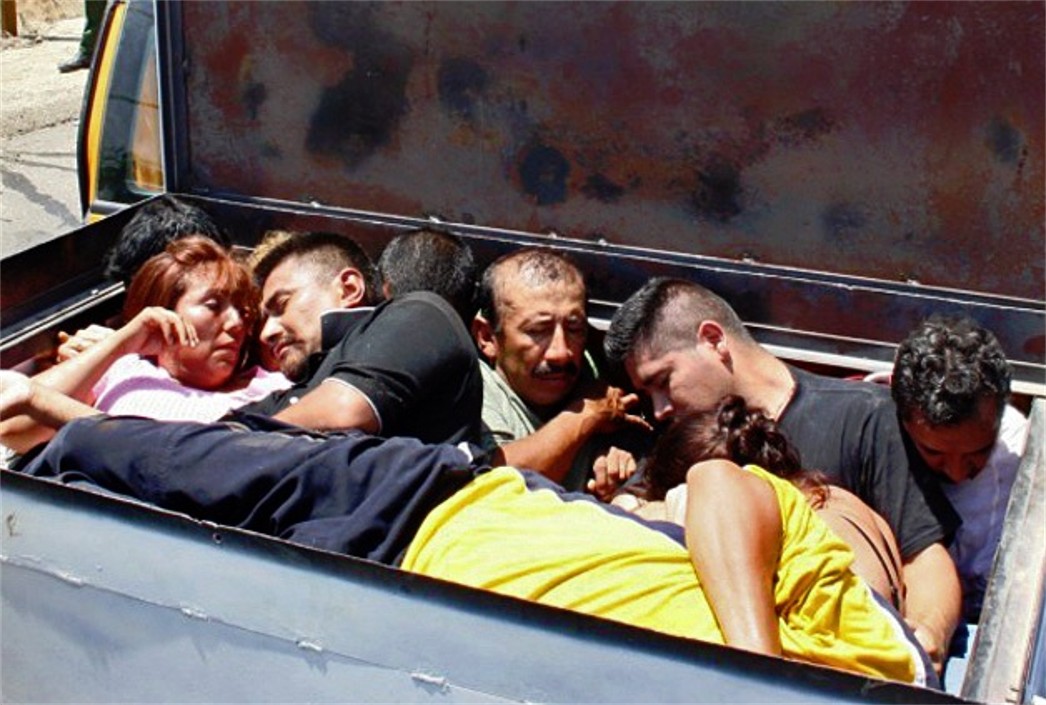
As more people are leaving their country of origin to go work/study abroad or to have a better life, the country of origin is left with less qualified people causing the country to become weaker hence accentuating poverty, corruption in the government, etc. Human smuggling and trafficking ‘feeds on poverty’ and it creates ‘greater restrictions to legal immigration.’ Global rules are needed because people are doing whatever it takes to live a better life.

Level: 

Image Type: 

Category: 

Brain Drain Index

Source: 

http://www.saworldview.com/article/brain-drain

Image: 

Brain Drain Index

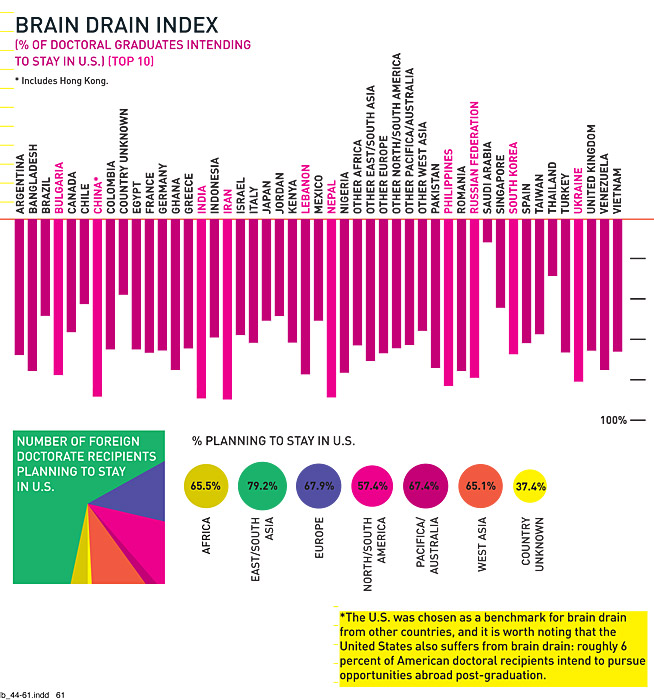
This chart represents the percentage of graduates planning on staying in US as opposed to returning to their country of origin.The countries’ percentage of doctoral grads that plan to stay in US are mostly from China, India, Iran, Nepal. The highest percentage of graduates from foreign countries planning to stay are mostly from east and south Asia of 79.2%. Consequences are that the countries of origin lack people with high skills; e.g. many doctors and nurses in Jamaica left to gain a higher wage/salary which is beneficial to the host country but not so much for the country of origin.

Level: 

Image Type: 

Category: 

Aquaculture Tries to Fill World's Insatiable Appetite for Seafood

Aquaculture Tries to Fill World's Insatiable Appetite for Seafood
Show


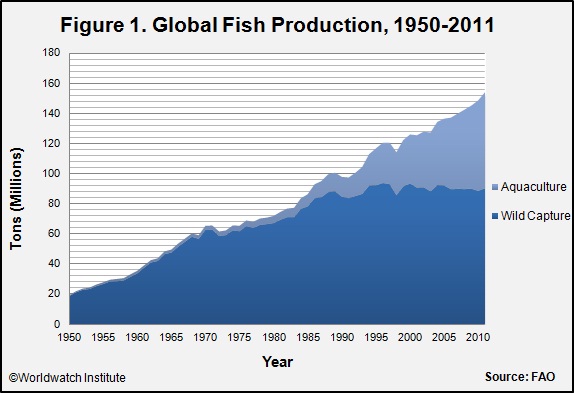
Total global fish production, including both wild capture fish and aquaculture, reached an all-time high of 154 million tons in 2011. Wild capture was 90.4 million tons that year, up 2 percent from 2010. This followed a 1.6-percent decline from 2009 to 2010. The 2011 global capture figure nearly matched the 2007 total of 90.3 million tons, which broke a four-year pattern of declining global wild capture. Since the late 1980s, however, wild capture production has essentially stagnated.


Level: 

Category: 

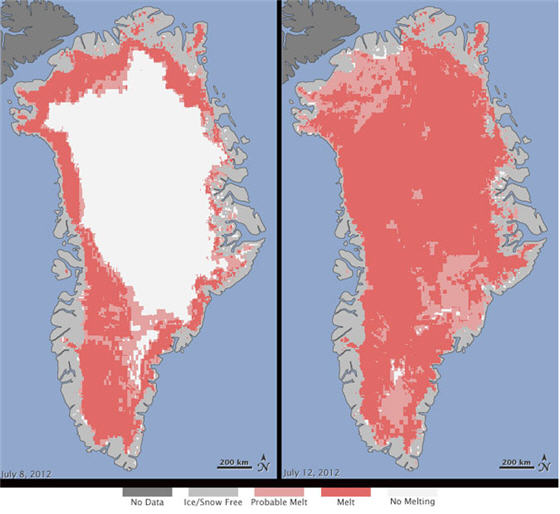
Satellite Data Indicates Unprecedented Greenland Ice Sheet Surface Melt

Satellite Data Indicates Unprecedented Greenland Ice Sheet Surface Melt
Show

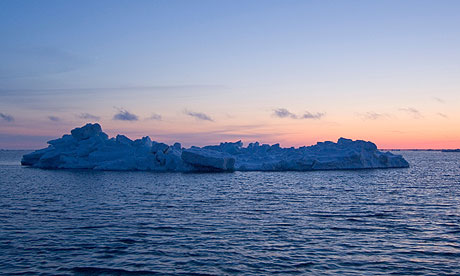
ASA says new satellite measurements indicate unprecedented recent Greenland ice sheet surface melt. The images above show the extent of surface melt over Greenland’s ice sheet over just a four day period - from July 8 (left) and July 12 (right). Measurements from three satellites showed that on July 8, about 40% of the ice sheet had undergone thawing at or near the surface. This melting dramatically accelerated to an estimated 97% of the ice sheet surface by July 12. On average in the summer, about half of the surface of Greenland's ice sheet naturally melts.

Level: 

Category: 

Carbon War Room

Source: 

http://www.carbonwarroom.com/

Image: 

Carbon War Room

The Carbon War Room harnesses the power of entrepreneurs to unlock gigaton-scale, market-driven solutions to climate change.

Level: 

Image Type: 

Category: 

Pages