Global

Timeline of Electronic Commerce

Source: 

http://blog.templatemonster.com/2010/09/08/history-of-ecommerce-timeline-infographic/

Image: 

Timeline of Electronic Commerce

This image shows a timeline of some of the important events throughout the history of electronic commerce. The timeline dates as far back as the 1960s when the beginnings of electronic commerce were noted with developments such as Electronic Data Interchange which allowed companies to carry out electronic transactions.

Level: 

Image Type: 

Category: 

World over-using underground water reserves for agriculture

Author: 

Chris Wickham
World over-using underground water reserves for agriculture
Show

LONDON, Aug 8 (Reuters) - The world is depleting underground water reserves faster than they can be replenished due to over-exploitation, according to scientists in Canada and the Netherlands.

The researchers, from McGill University in Montreal and Utrecht University in the Netherlands, combined groundwater usage data from around the globe with computer models of underground water resources to come up with a measure of water usage relative to supply.

Level: 

Category: 

On World Population Day, Nine Strategies to Stop Short of 9 Billion

Author: 

Robert Engelman
On World Population Day, Nine Strategies to Stop Short of 9 Billion
Show

Although most analysts assume that the world’s population will rise from today’s 7 billion to 9 billion by 2050, it is quite possible that humanity will never reach this population size.

Level: 

Category: 

Implementation of mitigation measures

Source: 

http://csrn.mcgill.ca/program.html

Image: 

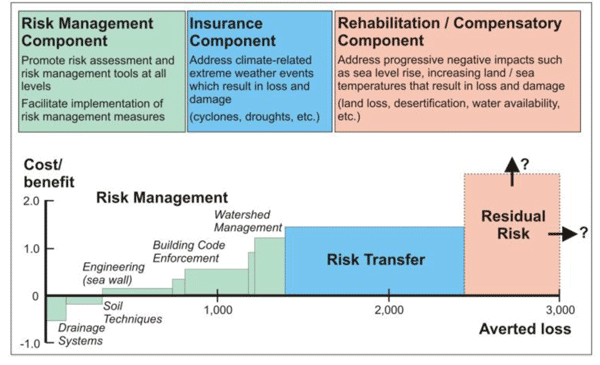
Implementation of mitigation measures

Through which measures can cost benefits be gained? In that example benefits are gained through three different actions. First through the implementation of a risk management, second through a risk transfer to insurance companies and third to rehabilitation and compensatory component.

Level: 

Image Type: 

Category: 

Cost benefits through natural disaster mitigation?

Source: 

http://www.quanterra.org/risk.htm

Image: 

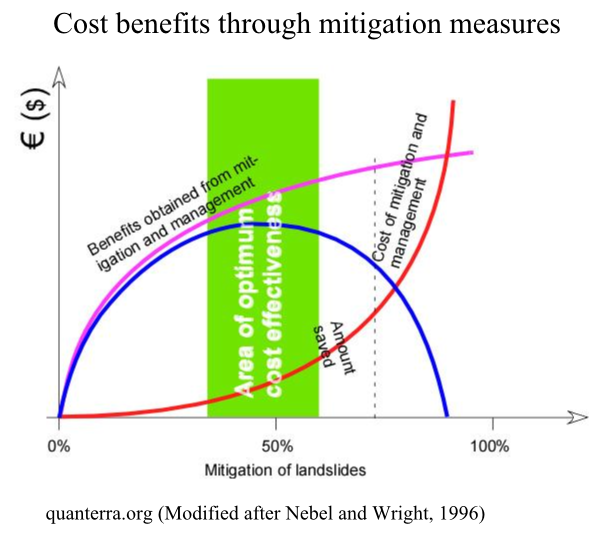
Cost benefits through natural disaster mitigation?

Chart shows the cost benefits through mitigation measures on the example of a landslide. It shows that only a certain effort in mitigation measures gain cost benefits. If to less measures are taken, the frequency and the impact of the events are still too high and a better optimum can be found. If too many measures are taken, the cost of mitigation and management will outnumber the gained benefits!

Level: 

Image Type: 

Category: 

Natural Disaster Risk Index

Source: 

http://peacewindsamerica.org/why-asia-pacific/

Image: 

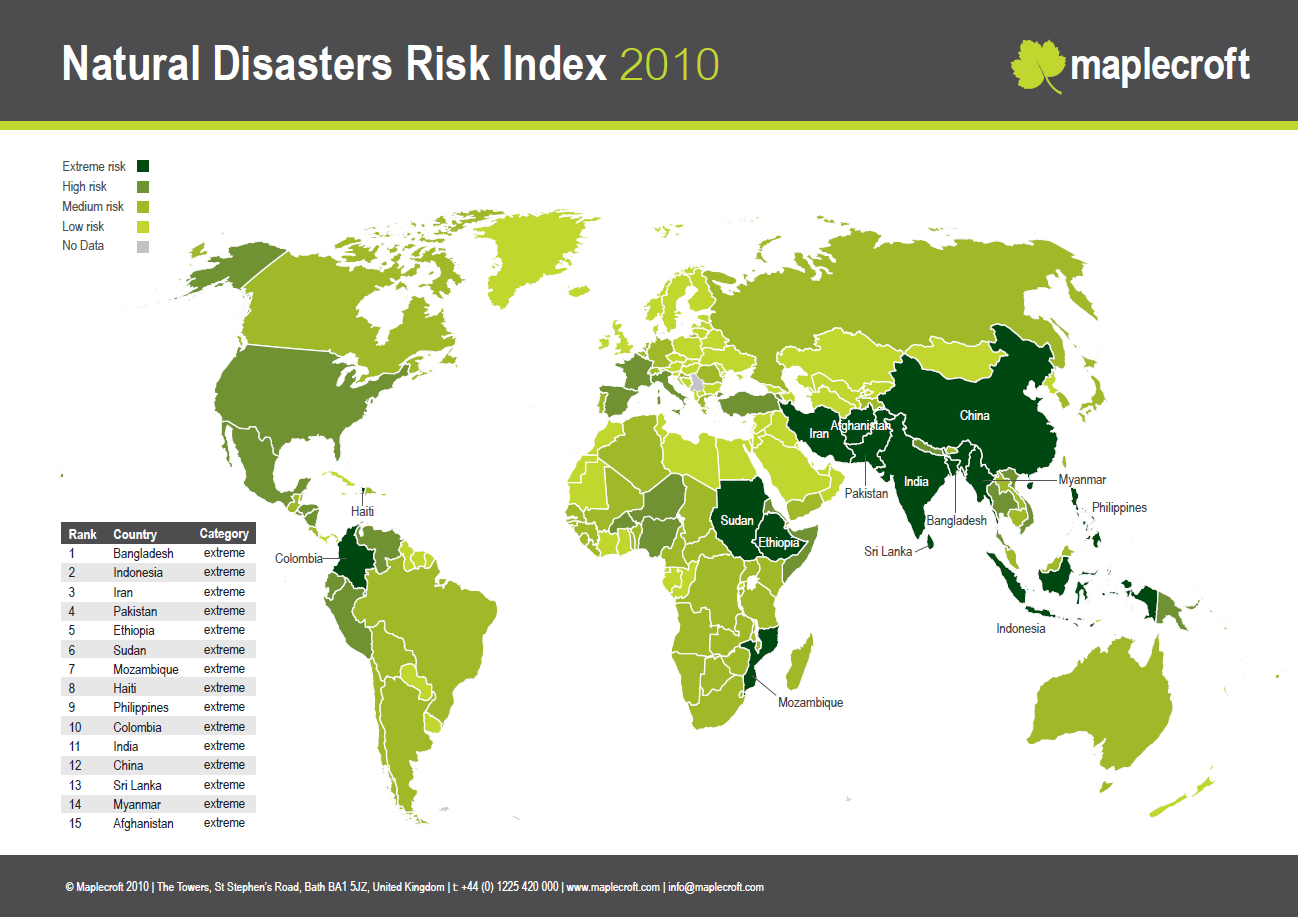
Natural Disaster Risk Index

The actual risk for a country to suffer in a long term from a natural disaster depends on the actual exposure but also on the vulnerability of a society (how can they cope and adapt to the event). Central America as well as big parts of Africa and Asia are at high risk to suffer in a long term from natural disasters.

Level: 

Image Type: 

Category: 

World Risk Index

Source: 

http://www.ehs.unu.edu/article/read/worldriskreport-2011

Image: 

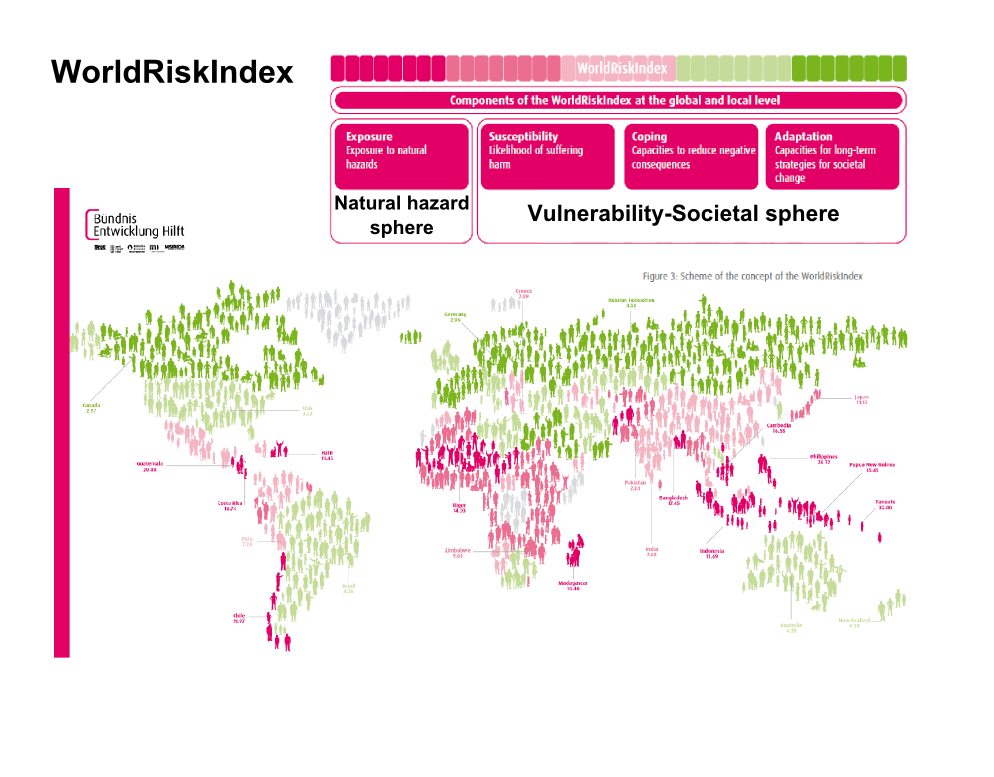
World Risk Index

The actual risk for a country to suffer in a long term from a natural disaster depends on the actual exposure but also on the vulnerability of a society (how can they cope and adapt to the event). Central America as well as big parts of Africa and Asia are at high risk to suffer for a long term from natural disasters.

Level: 

Image Type: 

Category: 

A comparison of the impact of an earthquake Chile and Haiti

Source: 

http://www.ehs.unu.edu/article/read/worldriskreport-2011

Image: 

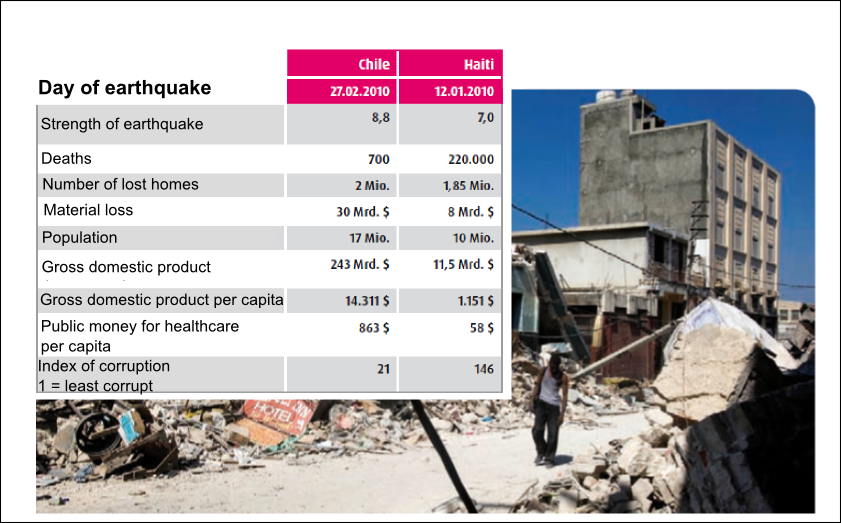
A comparison of the impact of an earthquake Chile and Haiti

The chart compares 2 earthquakes and their different results for the countries. The number of deaths for Haiti is far higher (higher population density and a lesser standard of living, worse conditions after the event). However, the material loss for Chile was higher due to a bigger economy but the actual impact of the economy was far less due to a higher GDP, quicker response and better measures after the event. Different factors of a country decide about the long-term impact of a natural disaster .

Image Type: 

Category: 

Level: 

Geographic Area: 

Annual economic loss from natural disasters as a percentage of GDP

Source: 

http://forum.maplecroft.com/showpage?section=cartograms&topic=cartogram_of_nat_dis_eco_loss_percent_GDP

Image: 

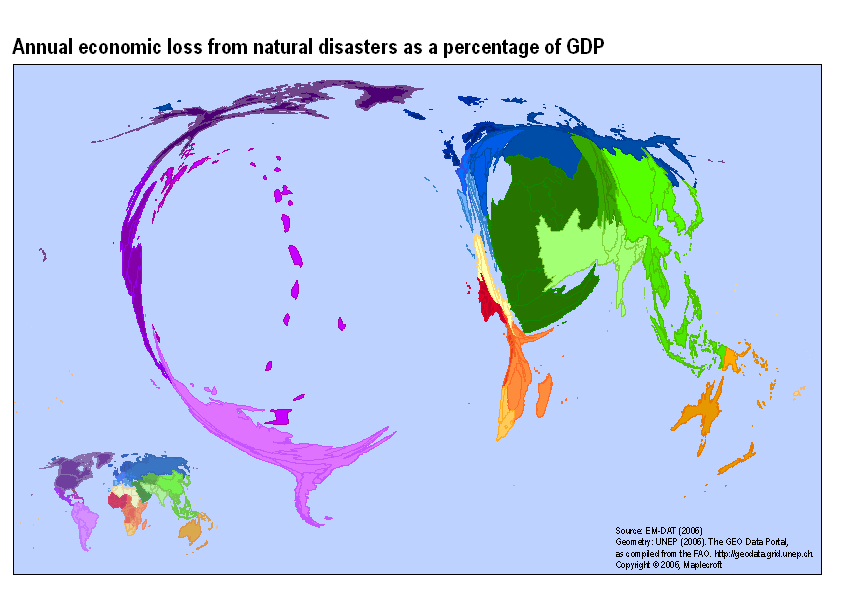
Annual economic loss from natural disasters as a percentage of GDP

The grafic shows the economic impacts for different countries. Even so that a lot of disasters hit the US the economic loss is insignificant. South Americas well as the Asian Regions, Africa and India are far more vulnerable for such events.

Level: 

Image Type: 

Category: 

Pages