Global

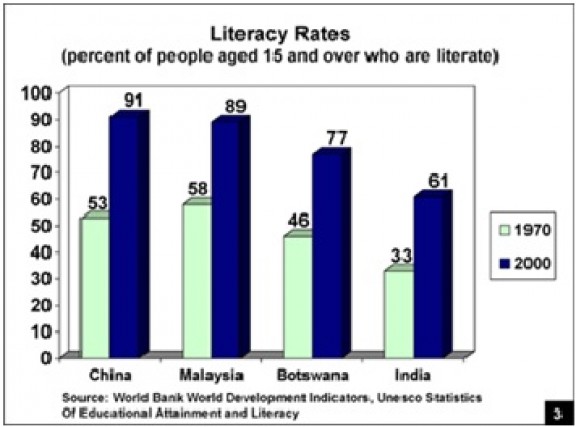
Literacy Rates Between 1970 and 2000

Source: 

World Bank

Image: 

Literacy Rates Between 1970 and 2000

Graph showing the literacy rates of several countries between 1970 and 2000, showing the increase in literacy rate after 30 years.

Level: 

Image Type: 

Category: 

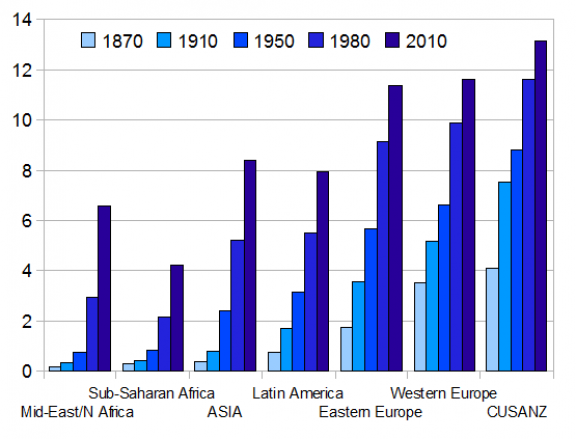
Average Education Over Past 150 Years

Source: 

http://www.ronanlyons.com/2009/07/01/building-a-better-picture-of-educations-role-in-economic-development/

Image: 

Average Education Over Past 150 Years

Graph showing the average years of education, by region, from the year 1870 through modern times.

Level: 

Image Type: 

Category: 

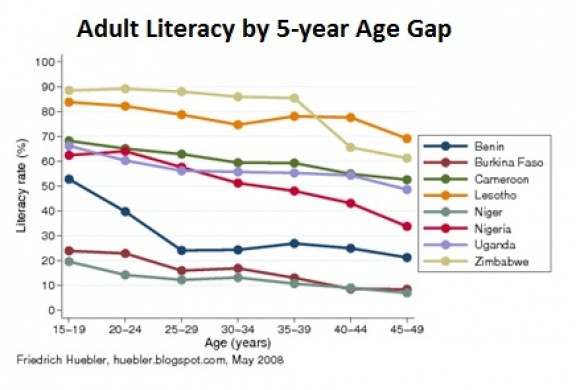
Adult Literacy Rates

Source: 

huebler.blogspot.com

Image: 

Adult Literacy Rates

Shows adult literacy rates by country, based on age intervals of 5 years

Level: 

Image Type: 

Category: 

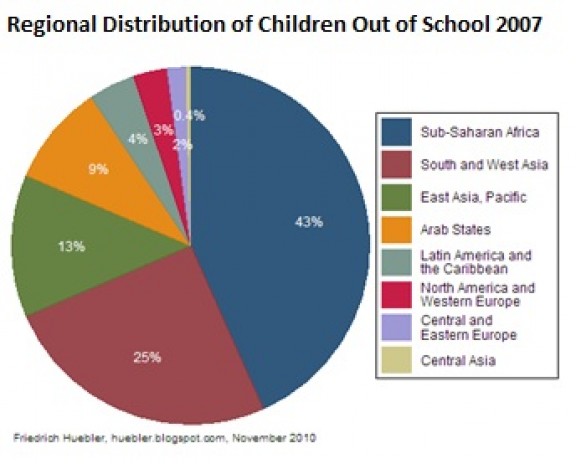
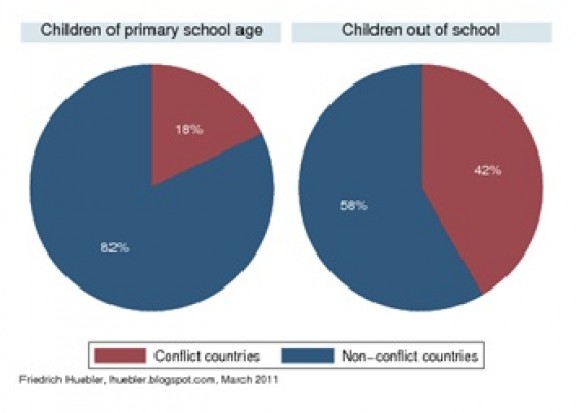
Primary School Attendance

Source: 

huebler.blogspot.com

Image: 

Primary School Attendance

Pie chart that highlights the relationship between conflict in a country and quality of education in a country. Children receive a worse education, typically, if their home country is involved in a conflict.

Level: 

Image Type: 

Category: 

World Education Ranking

Source: 

http://filipspagnoli.wordpress.com

Image: 

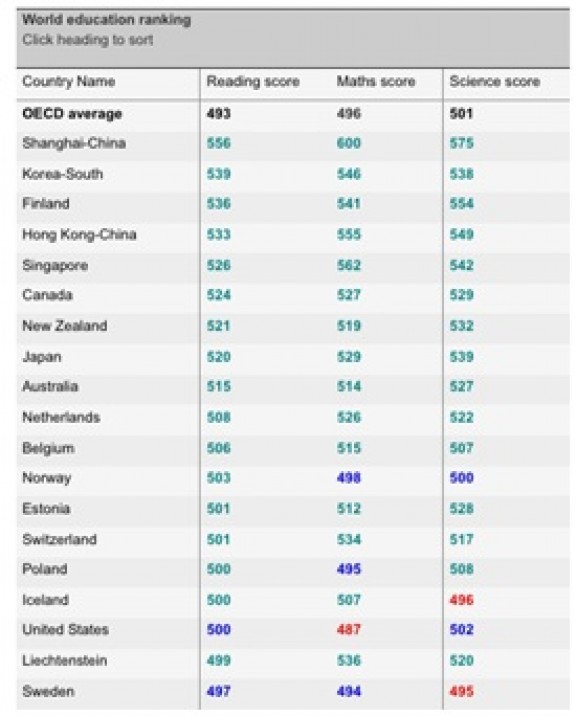
World Education Ranking

Table that shows education rankings of some of the top nations around the world

Level: 

Image Type: 

Category: 

Literacy Rates Map

Source: 

UN Human Development Report

Image: 

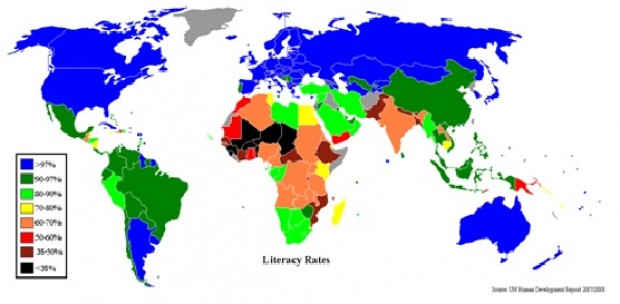
Literacy Rates Map

World map with nations color-coded based on their literacy rates.

Level: 

Image Type: 

Category: 

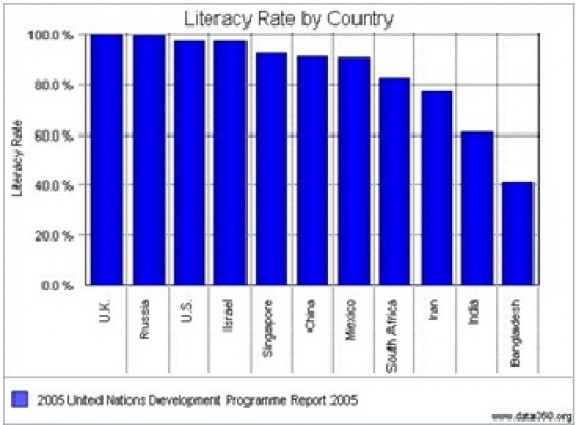
Literacy Rate by Country

Source: 

United Nations

Image: 

Literacy Rate by Country

Shows the literacy rates of several countries, including wealthy nations such as the UK, and poor nations such as Bangladesh.

Level: 

Image Type: 

Category: 

Pages