Global

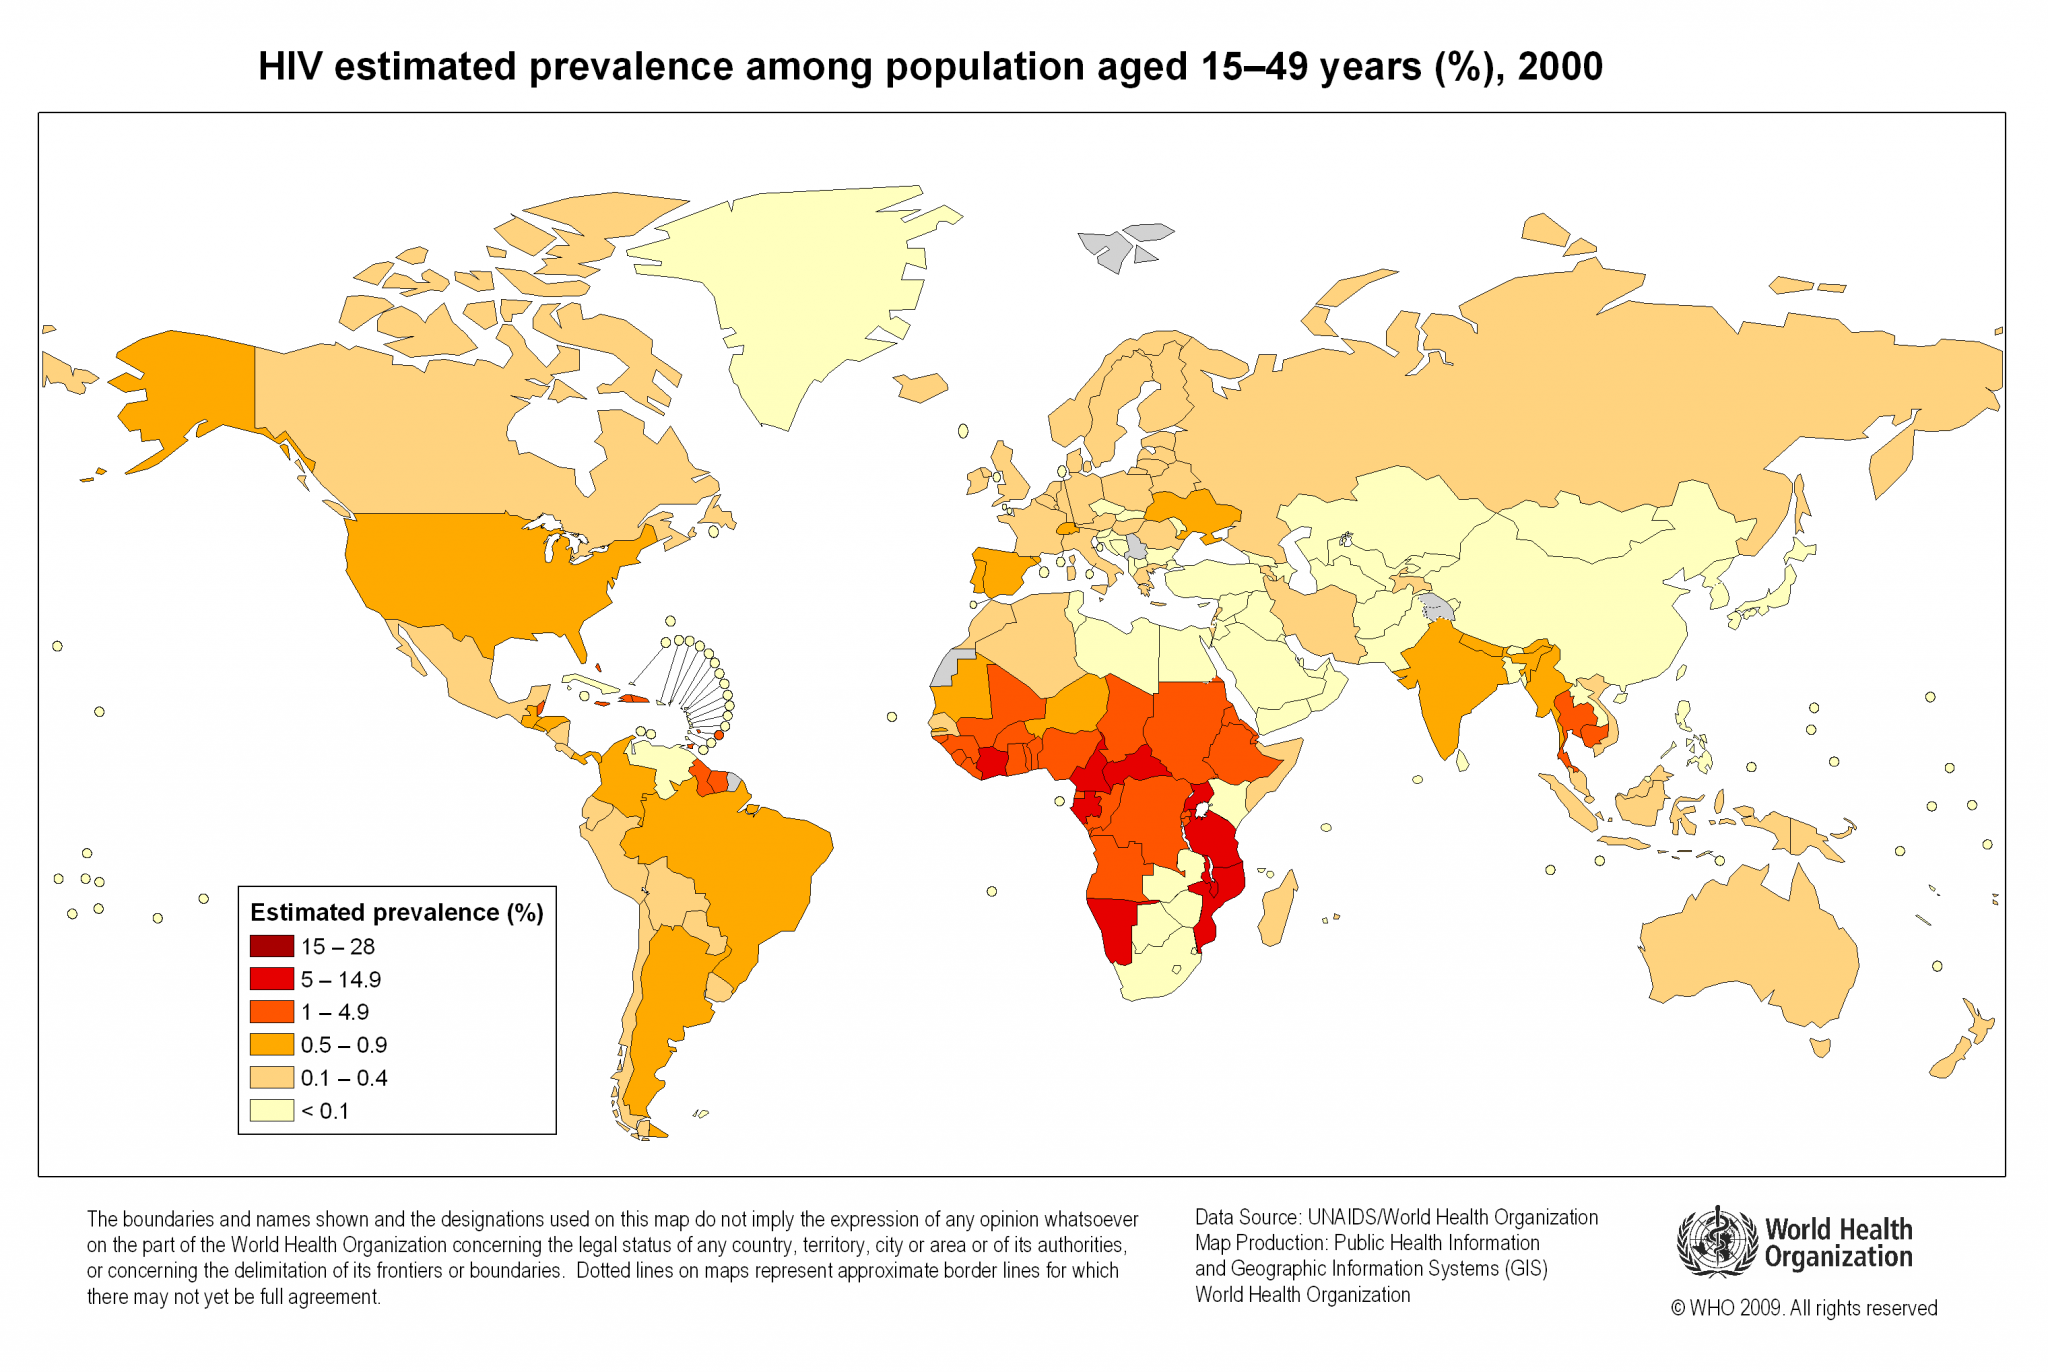
HIV prevalency 2000

Source: 

World Health Organization

Image: 

HIV prevalency 2000

A map showing HIV estimated prevalence among population aged 15-49 years (%), 2000

Level: 

Image Type: 

Category: 

Atrocities Timeline

Source: 

http://filipspagnoli.wordpress.com/stats-on-human-rights/statistics-on-war-conflict/statistics-on-violent-conflict/#1

Image: 

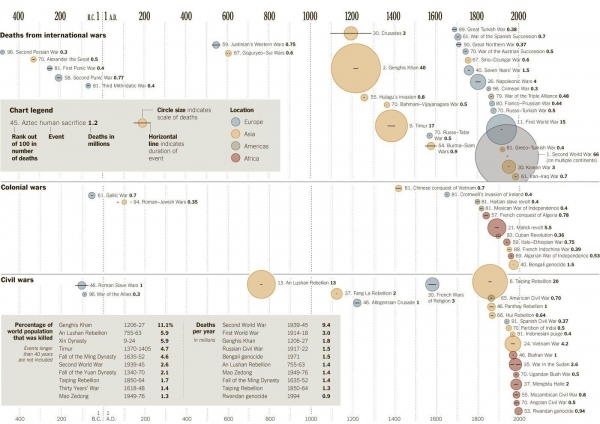
Atrocities Timeline

Timeline from 400BC to 2000AD showing the number of deaths from all recorded international wars, colonial wars, and civil wars.

Level: 

Image Type: 

Category: 

Armed Conflict

Source: 

http://news.lib.uchicago.edu/news/featured-electronic-resources/

Image: 

Armed Conflict

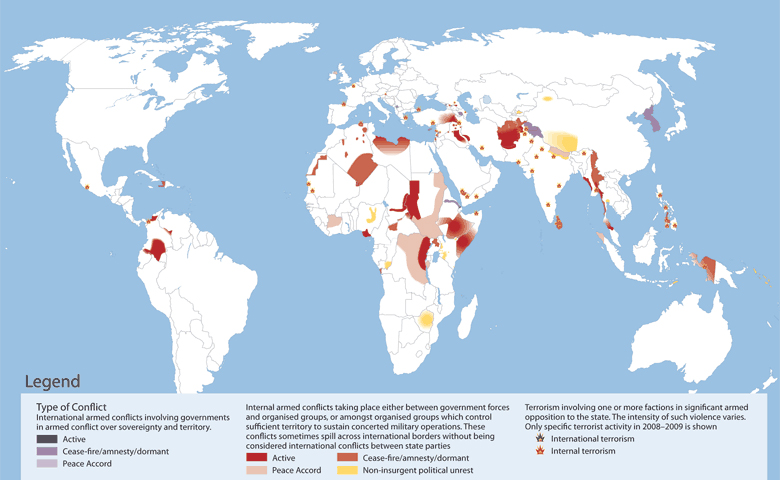
World map showing armed conflicts in different regions from 2008 to 2009.

Level: 

Image Type: 

Category: 

How is 100% renewable energy possible in Japan by 2020? PDF File

Taxonomy upgrade extras: 

field_vote: 

Docment: 

Source: 

personal library
How is 100% renewable energy possible in Japan by 2020? PDF version

How is 100% renewable energy possible in Japan by 2020? Power Point File

Taxonomy upgrade extras: 

field_vote: 

Docment: 

Source: 

personal library
How is 100% renewable energy possible in Japan by 2020?

Mutual Compromise Probability

Source: 

Center for International Development and Conflict Management - Peace and Conflict 2012

Image: 

Mutual Compromise Probability

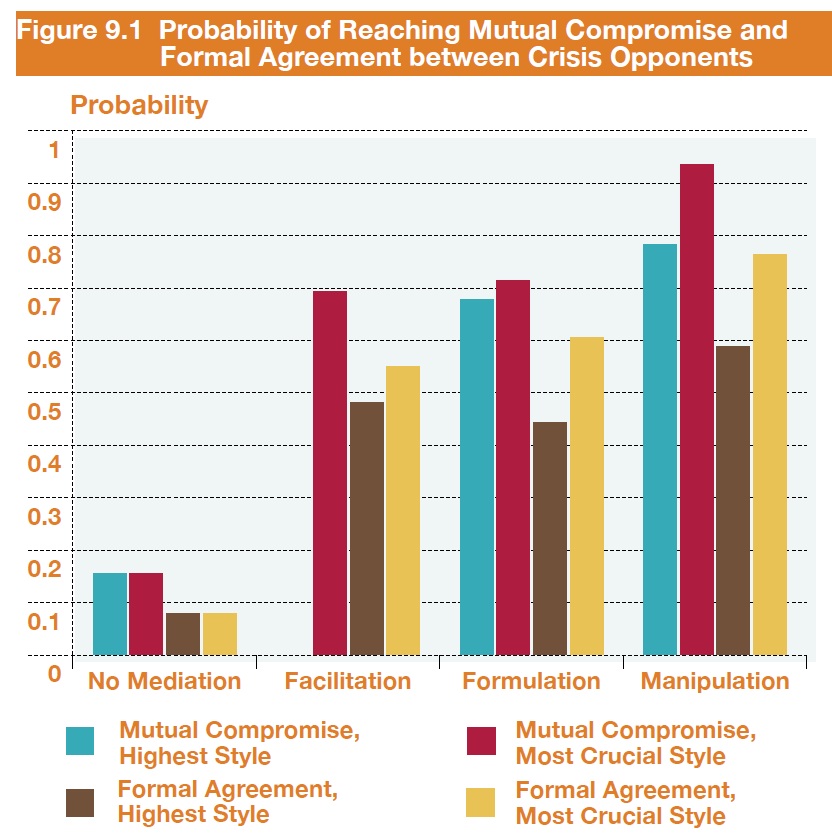
A graph showing the effectiveness of different forms for mediation. Highest style means that the mediation had a significant contribution whilst most crucial style means that the mediation was the most important factor.

Level: 

Image Type: 

Category: 

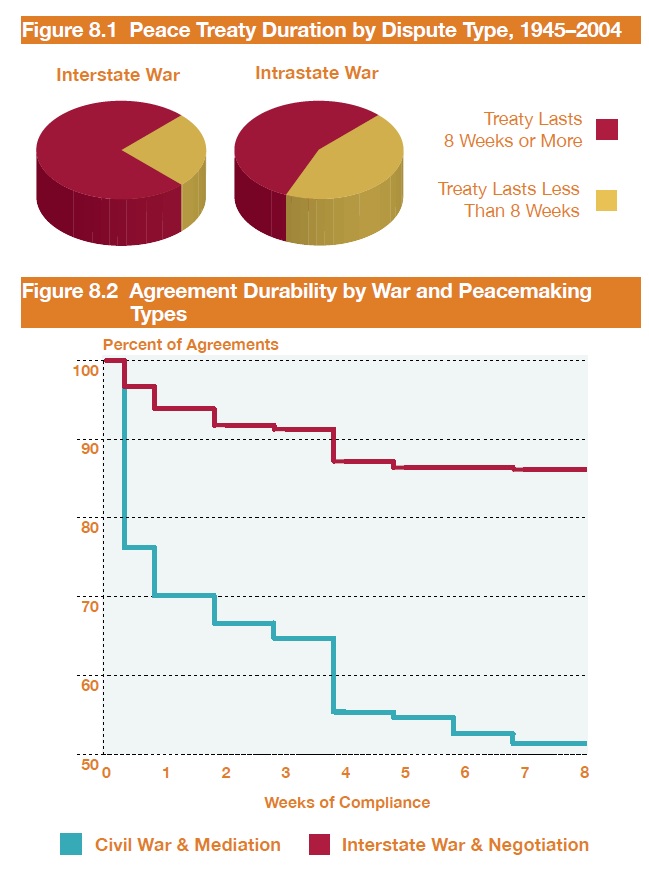
Peace Treaty Trend

Source: 

Center for International Development and Conflict Management - Peace and Conflict 2012

Image: 

Peace Treaty Trend

A pie chart showing the peace treaty duration by dispute type and a graph showing the agreemetn durability by war and peacemaking types.

Level: 

Image Type: 

Category: 

Pages