Graph

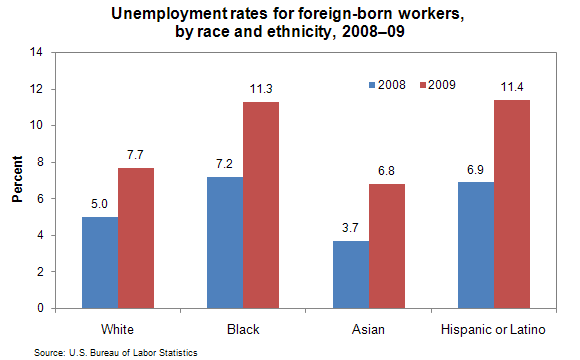
Unemployment rate for foreign-born workers

Source: 

http://www.bls.gov/opub/ted/2010/ted_20100324.htm

Image: 

Unemployment rate for foreign-born workers

This could be partially caused by economic recession. The largest gap: Hispanic or Latino population: 4.5% difference. The smallest gap: White population: 2.7% difference. Lower skilled jobs would be the first to go. A large population of less qualified immigrants are from Hispanic countries. And the population of higher skilled immigrants are mostly from European and Asian countries.

Level: 

Image Type: 

Category: 

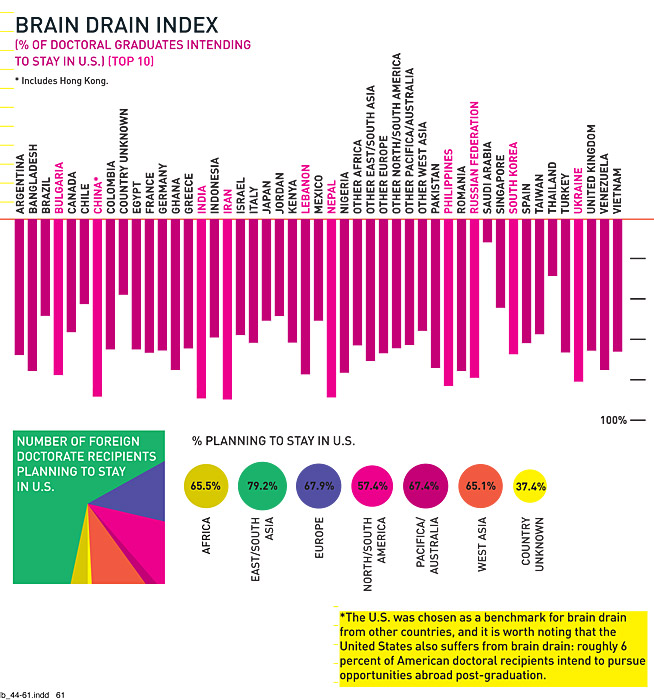
Brain Drain Index

Source: 

http://www.saworldview.com/article/brain-drain

Image: 

Brain Drain Index

This chart represents the percentage of graduates planning on staying in US as opposed to returning to their country of origin.The countries’ percentage of doctoral grads that plan to stay in US are mostly from China, India, Iran, Nepal. The highest percentage of graduates from foreign countries planning to stay are mostly from east and south Asia of 79.2%. Consequences are that the countries of origin lack people with high skills; e.g. many doctors and nurses in Jamaica left to gain a higher wage/salary which is beneficial to the host country but not so much for the country of origin.

Level: 

Image Type: 

Category: 

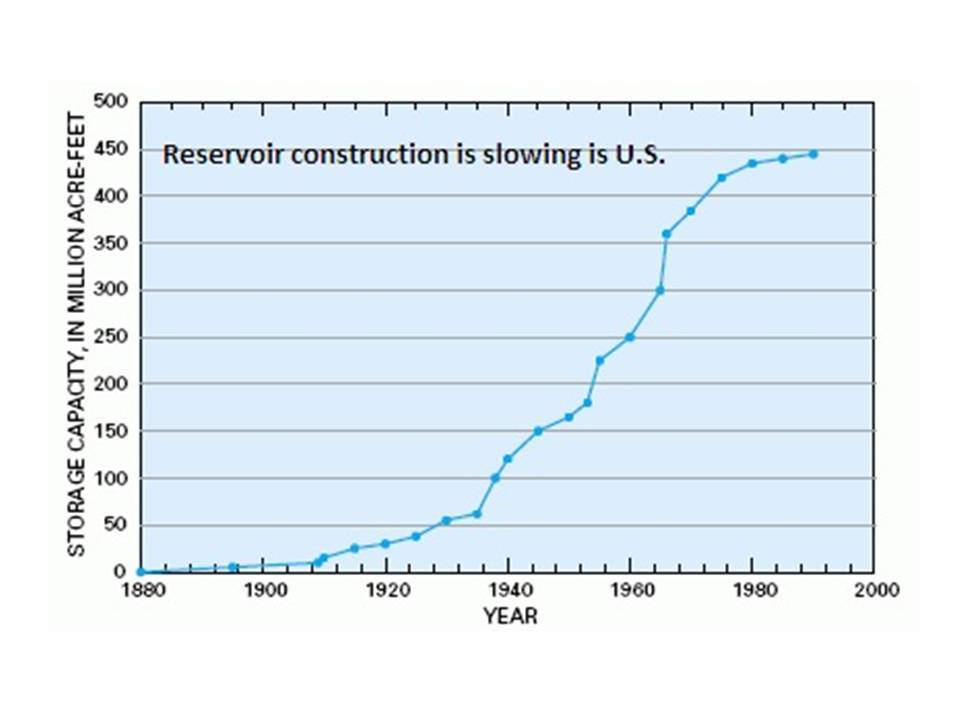
Reservoir Construction is slowing is U.S

Source: 

www.wikipedia.com

Image: 

Reservoir Construction is slowing is U.S

You need lots of water and a lot of land where you can build a dam and reservoir, which all takes a LOT of money, time, and construction. The trend for the future will probably be to build small-scale hydro plants that can generate electricity for a single community.

Image Type: 

Category: 

Level: 

Geographic Area: 

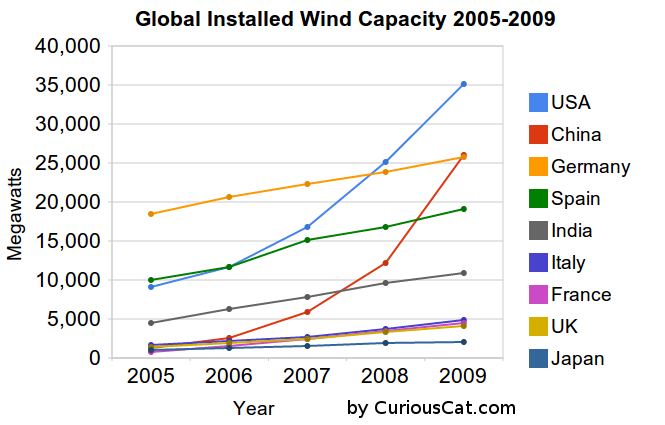
Glocal Installed Wind Capacity 2005-2009

Source: 

www.wikipedia.com

Image: 

Glocal Installed Wind Capacity 2005-2009

According to graphs, you can see that after 2005 the total wind power capacity soars and the top three country contribute to this increase are US, China and Germany.

Level: 

Image Type: 

Category: 

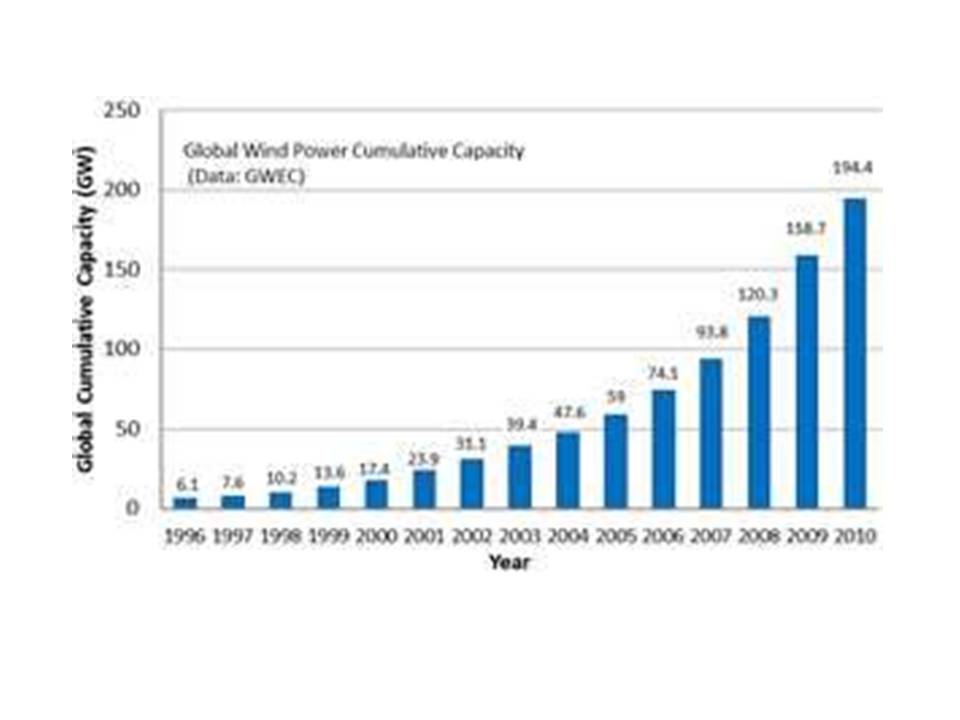
Global Wind Power Cumulative Capacity

Source: 

www.wikipedia.com

Image: 

Global Wind Power Cumulative Capacity

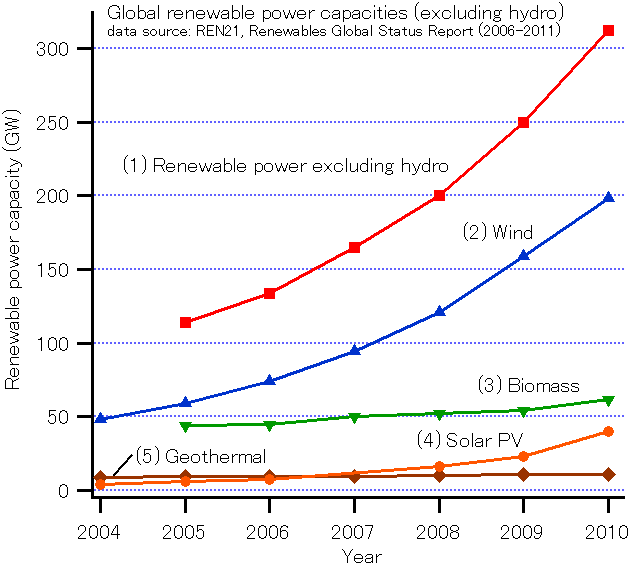
According to graphs, you can see that after 2005 the total wind power capacity soars and the top three country contribute to this increase are US, China and Germany.

Level: 

Image Type: 

Category: 

Pages