Graph

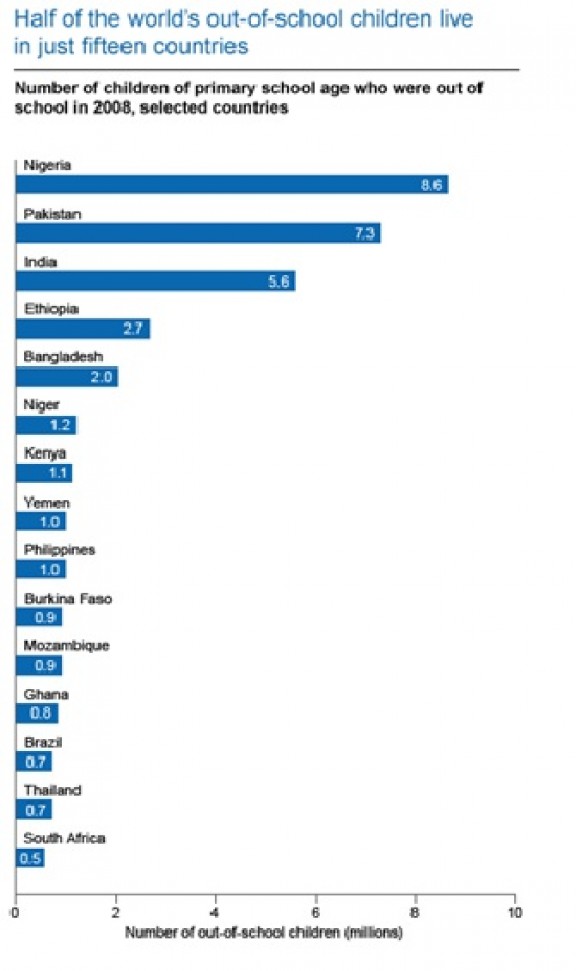
Half of Out of School Children in 15 Countries

Source: 

UNESCO Education For All Global Monitoring Report 2011

Image: 

Half of Out of School Children in 15 Countries

Shows the 15 countries with the most children not attending school in the world, which happen to contain half of the world's out-of-school children. Notice that all are impoverished nations.

Level: 

Image Type: 

Category: 

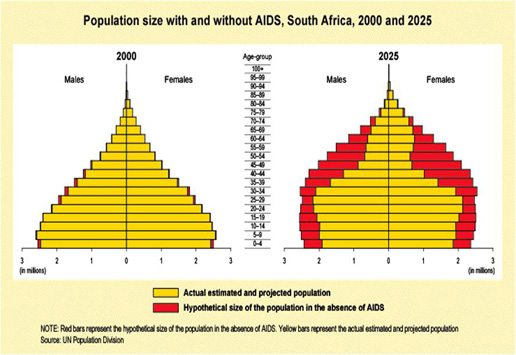
South Africa Population projection with and without AIDS

Source: 

http://www.google.com/imgres?imgurl=http://img.over-blog.com/600x329/4/05/56/46/GAR2004_13_en.gif&imgrefurl=http://julieneymas.over-blog.com/1-index.html&h=329&w=598&sz=54&tbnid=iFerORzOFZQrNM&tbnh=166&tbnw=303&zoom=1&usg=__pmMm35ijMwFcDEzJeRbj8bmdyTA=&hl=fr&sa=X&ei=_c4aUKSDOurhigL4hYHgAg&ved=0CC0Q8g0

Image: 

South Africa Population projection with and without AIDS

This graph is showing the impact of AIDS on South africa population

Level: 

Image Type: 

Category: 

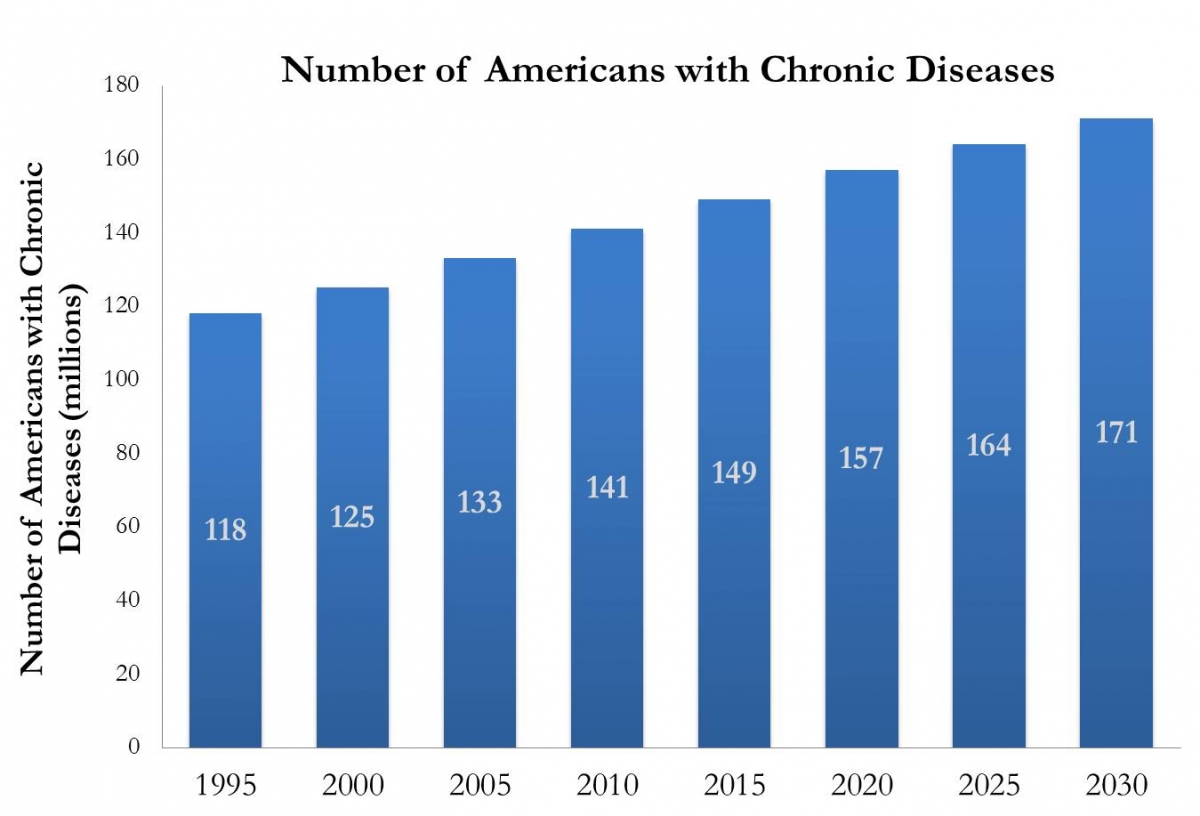
Evolution of American chronic disease

Source: 

http://www.google.com/imgres?imgurl=http://womeningovernment.org/files/Chronic%2520Disease%2520Graph.jpg&imgrefurl=http://womeningovernment.org/care-coordination/chronic-care-management/economic-impact&h=816&w=1200&sz=333&tbnid=xJfKTXvdKdJd1M:&tbnh=82&tbnw=121&zoom=1&usg=__rOMLtH249eu8TNpuaqc_bhGo0a4=&docid=WOqcx6RpwRKgVM&hl=fr&sa=X&ei=t80aUJiGLOeBiwLHwYHwBw&ved=0CDoQ9QEwAQ&dur=763

Image: 

Evolution of American chronic disease

Ths map is showing the evolution of american with chronic disease between 1995 and 2030

Level: 

Image Type: 

Category: 

The Waning of War

Source: 

http://filipspagnoli.wordpress.com/stats-on-human-rights/statistics-on-war-conflict/statistics-on-violent-conflict/#1

Image: 

The Waning of War

World-wide battle deaths per 100,000 people from 1940s to 2000s.

Level: 

Image Type: 

Category: 

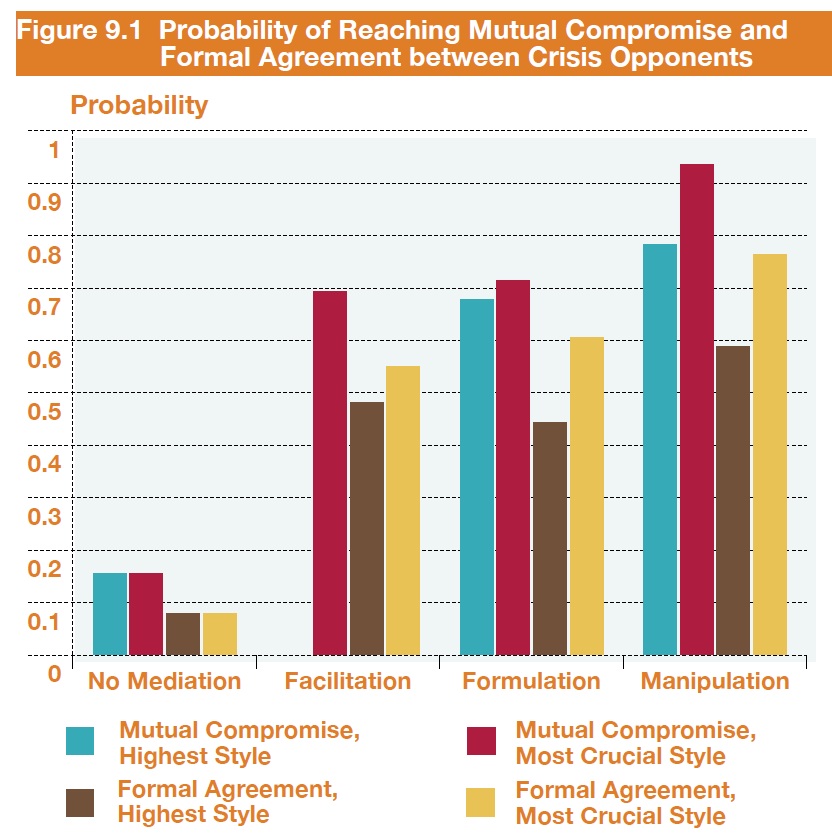
Mutual Compromise Probability

Source: 

Center for International Development and Conflict Management - Peace and Conflict 2012

Image: 

Mutual Compromise Probability

A graph showing the effectiveness of different forms for mediation. Highest style means that the mediation had a significant contribution whilst most crucial style means that the mediation was the most important factor.

Level: 

Image Type: 

Category: 

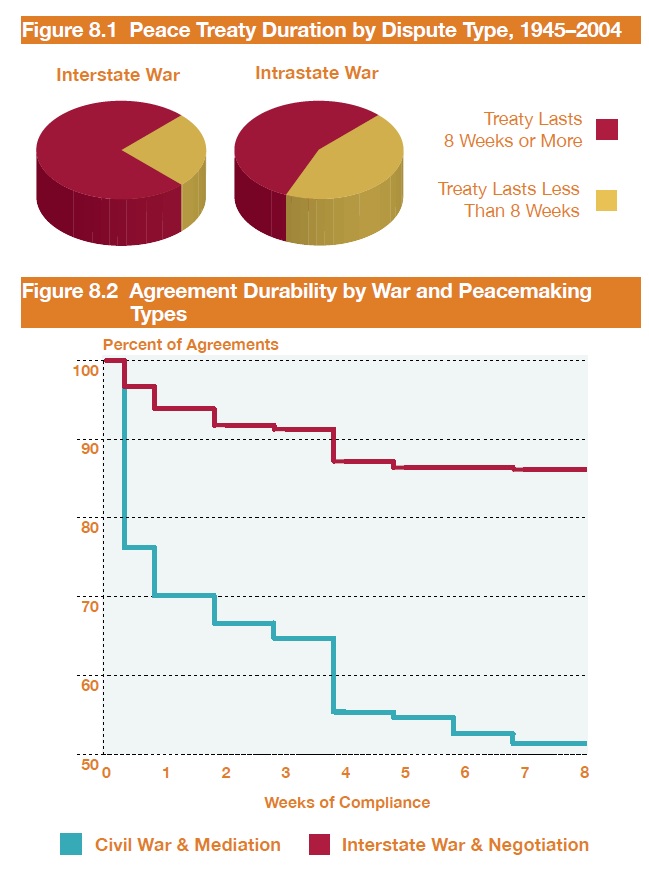
Peace Treaty Trend

Source: 

Center for International Development and Conflict Management - Peace and Conflict 2012

Image: 

Peace Treaty Trend

A pie chart showing the peace treaty duration by dispute type and a graph showing the agreemetn durability by war and peacemaking types.

Level: 

Image Type: 

Category: 

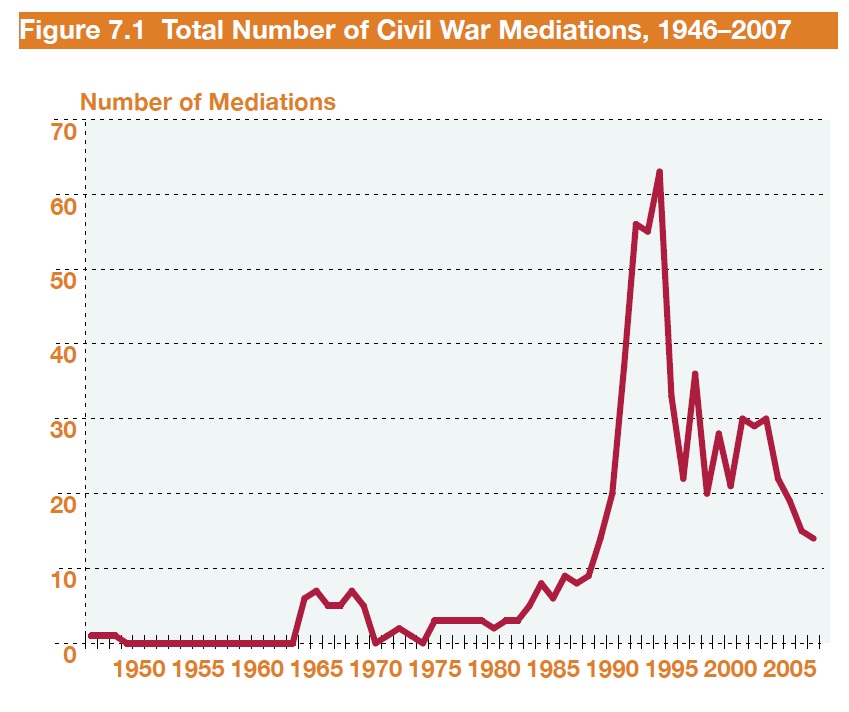
Civil War Mediations, 1946-2007

Source: 

Center for International Development and Conflict Management - Peace and Conflict 2012

Image: 

Civil War Mediations, 1946-2007

A graph showing the total number of civil war mediations and the large increase at the end of the Cold War.

Level: 

Image Type: 

Category: 

Pages