Graph

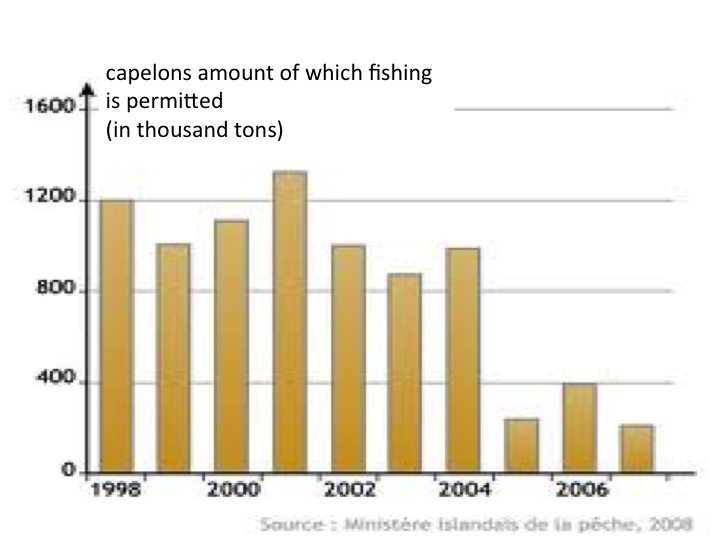
fishing quota

Source: 

http://lelivrescolaire.fr/3248/2_La_peche_en_Islande_rivalites_et_tensions.html#Document=8980

Image: 

fishing quota

fishing quota

Image Type: 

Category: 

Level: 

Geographic Area: 

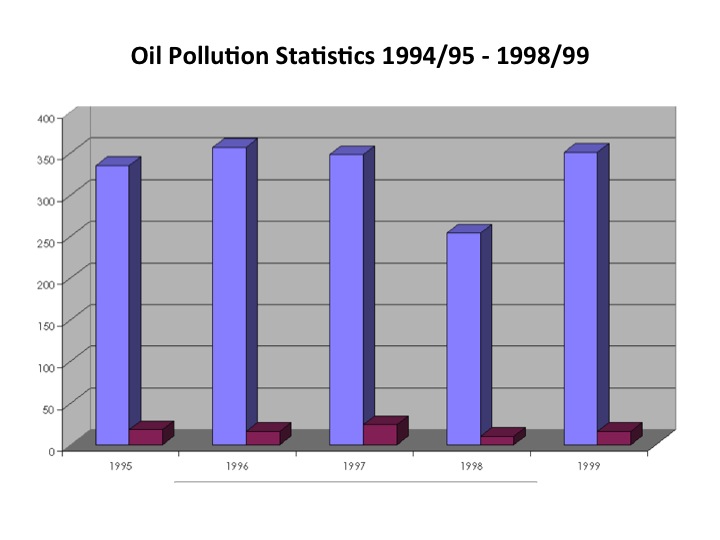
Oil Pollution Statistics 1994/95 - 1998/99

Source: 

http://www.aph.gov.au/Parliamentary_Business/Bills_Legislation/bd/bd0001/01bd027

Image: 

Oil Pollution Statistics 1994/95 - 1998/99

Worldwide, between 1974 and 1989, there were 774 accidents involving oil spills greater than 7 tonnes. Since 1970 there have only been two major spills (more than 1000 tonnes) in Australia. The following table indicates the number of reported spills and responses pursuant to the National Plan between 1994/95 and 1998/99.

Level: 

Image Type: 

Category: 

Average number of major oil spills (over 700 tonnes)

Source: 

http://www.marisec.org/shippingfacts/environmental/reduction-in-marine-pollution.php?SID=48adffcc673031547a190b20c364718b

Image: 

Average number of major oil spills (over 700 tonnes)

Important advances have been in the design of oily water separating equipment for machinery space bilges and oil tanker discharges, and in the monitoring and control of the discharge of such mixtures. These technological advances have allowed international regulations to be adopted, reducing the permitted operational discharge of oil effluent from machinery space bilges from 100 parts per million (ppm) to 15ppm.

Level: 

Image Type: 

Category: 

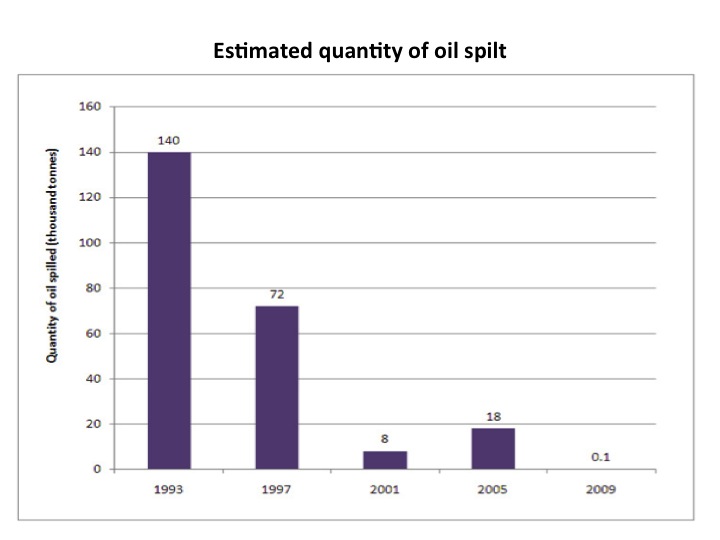
Estimated quantity of oil spilt

Source: 

http://www.marisec.org/shippingfacts/environmental/reduction-in-marine-pollution.php?SID=48adffcc673031547a190b20c364718b

Image: 

Estimated quantity of oil spilt

The introduction of industry practices such as crude oil washing for oil tankers, coupled with segregated ballast requirements for tankers, has contributed significantly towards reducing operational pollution. The entry into force of the international convention MARPOL 73/78 is credited with a substantial positive impact in decreasing the amount of oil that enters the sea from maritime transportation activities.

Level: 

Image Type: 

Category: 

World seaborne trade (crude oil/oil products) tonnes

Source: 

http://www.marisec.org/shippingfacts/environmental/reduction-in-marine-pollution.php?SID=48adffcc673031547a190b20c364718b

Image: 

World seaborne trade (crude oil/oil products) tonnes

In tonnage terms, the amount of oil transported by sea increased from 1,600 million tonnes in 1992 to over 2,400 million tonnes in 2008. Over 34,000 million tonnes was carried over the 16 year period. By contrast, the number of major oil spills during the same period shows a steady reduction. Although serious accidents occasionally occur - the loss of the 'Erika' and 'Prestige' being recent high profile examples - the trend shows a continuing improvement, both in quantity and frequency of oil spills each year.

Level: 

Image Type: 

Category: 

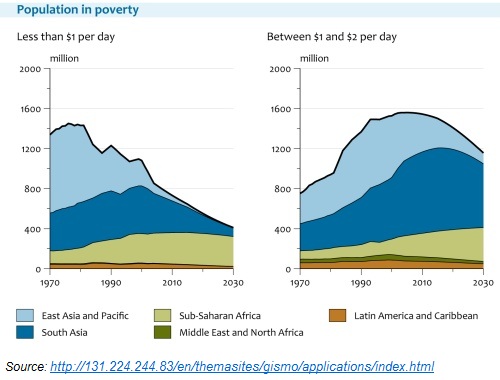
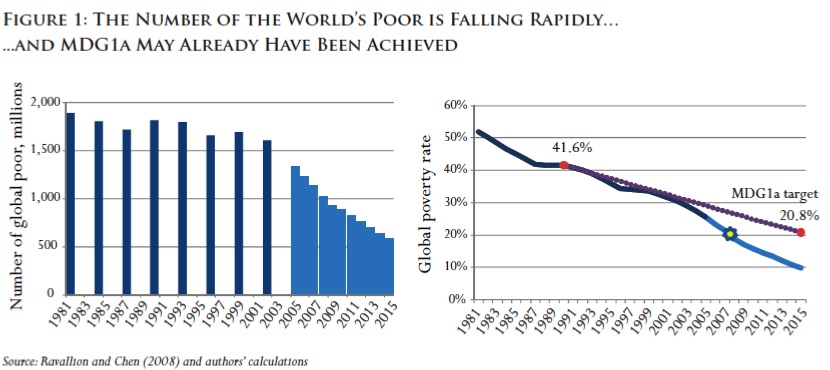
Global Poverty in Numbers

Source: 

http://www.brookings.edu/~/media/research/files/papers/2011/1/global%20poverty%20chandy/01_global_poverty_chandy.pdf

Image: 

Global Poverty in Numbers

Graph showing the declining numbers and the target for the Millenium Development Goals.

Level: 

Image Type: 

Category: 

Pages